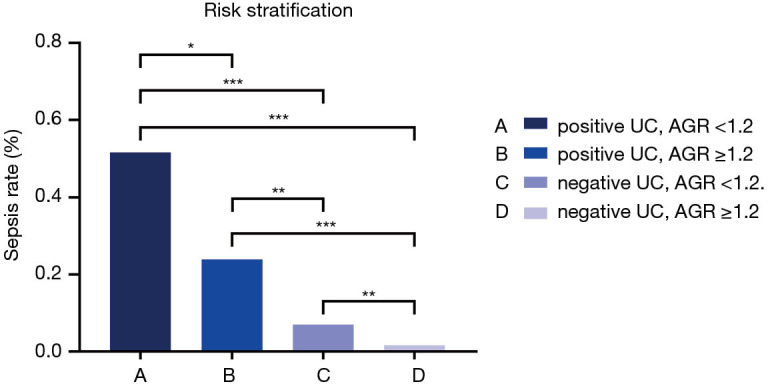
Figure 2.

Sepsis rate for different patient group stratified by UC and AGR. *P<0.05; **P<0.01; ***P<0.001. UC, urine culture; AGR, albumin globulin ratio.

Sepsis rate for different patient group stratified by UC and AGR. *P<0.05; **P<0.01; ***P<0.001. UC, urine culture; AGR, albumin globulin ratio.