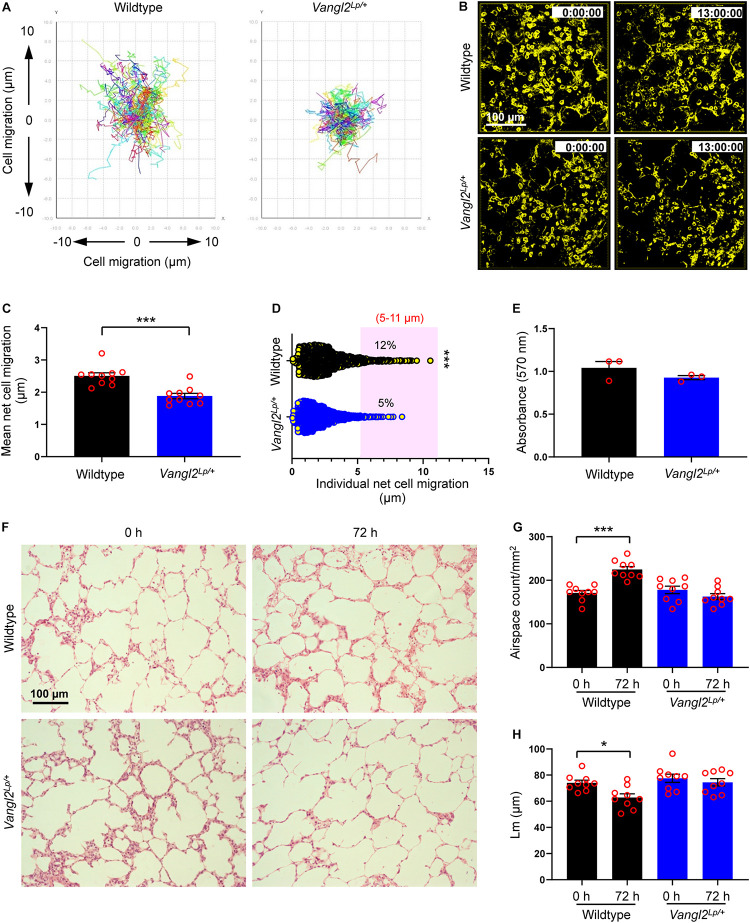
FIGURE 1.
Alveolar epithelial cell migration is disrupted in Vangl2Lp/+ mice during ex vivo alveologenesis. (A) Traces of individual cell tracking over 13 h in a single field from wildtype and Vangl2Lp/+ P3 mouse PCLS. (B) Deconvolved widefield 3D z-stack images extracted from 13 h time-lapse videos (Supplementary Videos 1, 2) of wildtype (top panels) and Vangl2Lp/+ (bottom panels) P3 PCLS labeled with EpCAM-FITC. (C) Mean net epithelial cell migration over 13 h of time-lapse imaging of P3 PCLS. n = 3 independent experiments using three separate mice for each group; at least three fields were quantified from each lung slice from each mouse per group per experiment. Each dot represents mean net epithelial cell migration per field. Mann–Whitney U-test, ***p = 0.0001. (D) Individual net cell migration in wildtype and Vangl2Lp/+ P3 PCLS after 13 h of time-lapse imaging (each dot represents a single cell). A total of 1248 cells in wildtype and 1635 cells in Vangl2Lp/+ P3 PCLS were tracked. Cells fall within the area highlighted in pink were highly motile and migrated between 5 and 11 μm. n = 3 independent experiments using three separate mice for each group. Mann–Whitney U-test, ***p = 0.0007. (E) MTT cell viability assay comparing wildtype and Vangl2Lp/+ P3 PCLS at the end of 13 h time-lapse; n = 3 independent experiments using three separate mice, with duplicate slices per condition per experiment; Mann–Whitney U-test. (F) H&E-stained sections from P3 PCLS at 0 and 72 h ex vivo culture of wildtype (top panels) and Vangl2Lp/+ (bottom panels) mice. Airspace count (G) and mean linear intercept (Lm) (H) obtained from H&E sections of P3 PCLS of wildtype and Vangl2Lp/+ mice at 0 and 72 h; n = 3 independent experiments using three separate mice, three H&E sections from each PCLS from each mouse were quantified per group per experiment. Each dot represents counts per field; one-way ANOVA with Tukey’s post hoc test, ***p < 0.001, *p < 0.05. All data are presented as mean ± SEM.

