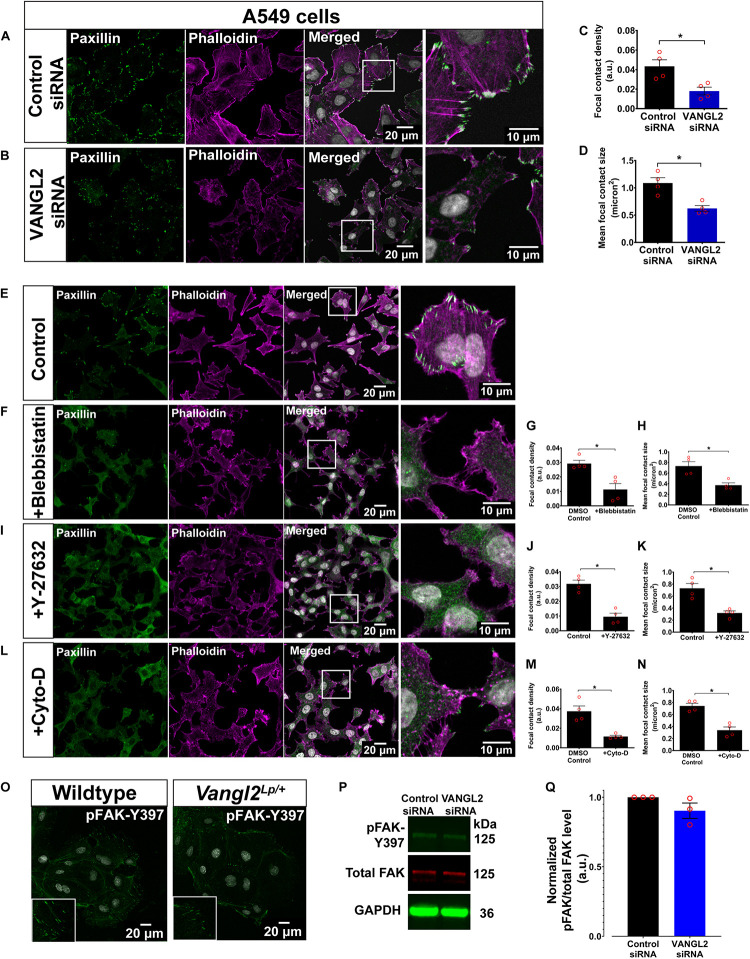
FIGURE 4.
A549 treated with actomyosin inhibitors phenocopy actin cytoskeleton and focal adhesion aberrations following siRNA knockdown of VANGL2. Representative images showing A549 transfected with (A) control siRNA or (B) VANGL2 siRNA. A549 labeled with phalloidin (magenta) to visualize F-actin and paxillin (green) for focal contacts. Nuclei were stained with DAPI (gray). Quantification of focal contact density (C) and mean focal contact size (micron2) (D) in control siRNA- or VANGL2 siRNA-treated A549 cells. n = 4 independent experiments; two technical replicates for each group per experiment; each dot represents mean value per experiment. Mann–Whitney U-test, ∗p < 0.05. Representative images showing control A549 without treatment (E), A549 treated with 25 μM blebbistastin for 30 min (F), 10 μM Y-27632 for 1 h (I), or 0.5 μM cytochalasin D for 30 min (L), and their corresponding focal contact density and mean focal contact size quantification (G,H,J,K,M,N). No morphological difference was observed in the DMEM-DMSO control or DMEM only control cells so only representative control cell images are shown. Cells were stained with phalloidin (magenta) and paxillin (green). Nuclei were stained with DAPI (gray). (O) Representative images showing wildtype and Vangl2Lp/+ TECs stained with pFAK-Y397 (green). Nuclei were stained with DAPI (gray). Representative western blots show the levels of pFAK-Y397 (green), total FAK (red), reference protein GAPDH (green) (P), and quantification of pFAK levels normalized to total FAK levels (Q). See Supplementary Figure S4 for whole western blot. n = 3 independent experiments. All data are presented as mean ± SEM.

