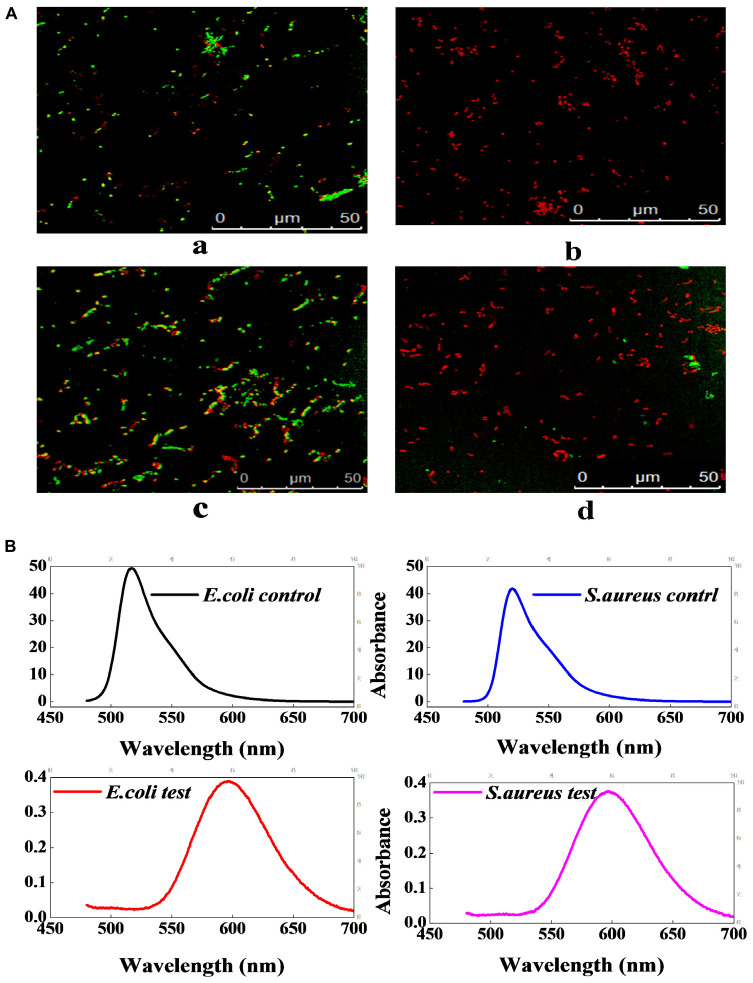
FIGURE 5.
The effect of lacidophilin on the cell membrane integrity of the two indicator bacteria. Fluorescence micrograph of E. coli and S. aureus with FDA/PI staining (A); the S. aureus used as control (a), the treated S. aureus (b), the E. coli used as control (c), the treated E. coli (d). Fluorescence spectrum of E. coli and S. aureus with FDA/PI staining (B); the excitation wavelength was 450 nm.

