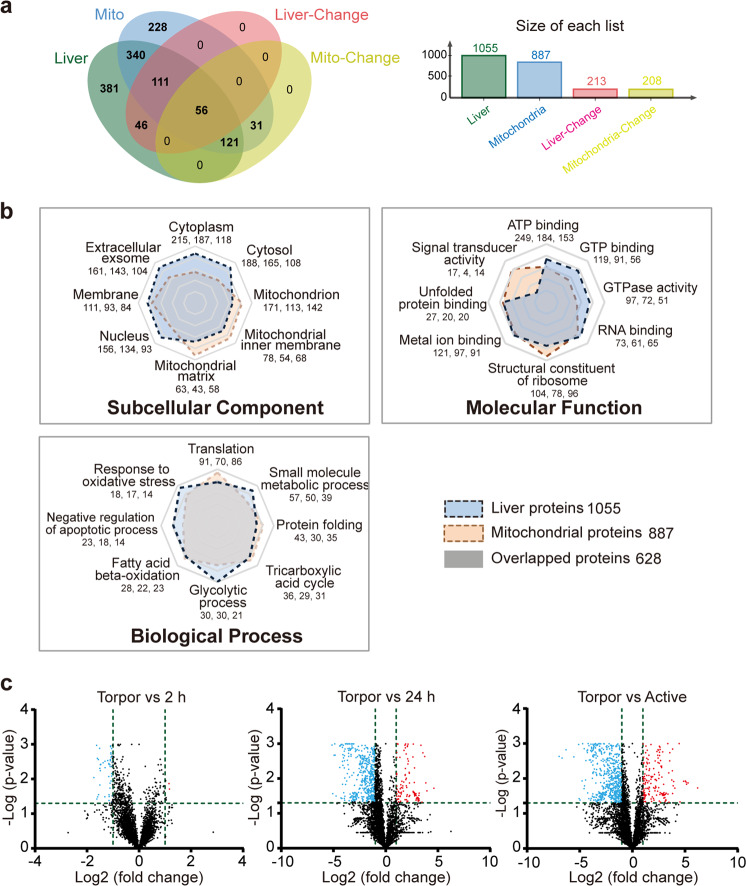
Fig. 1. Analysis of whole-cell and mitochondrial proteomes of the liver of hibernating bats.
a Venn plots. b Radar plots of subcellular component, molecular function, and biological processes. The three numbers below each of the sub-category indicate the number of total, liver, and liver mitochondrial proteins identified, respectively. c Volcano plots: proteins that have a significantly higher level in torpid bats are dotted in red, and those that had a lower level are dotted in blue.

