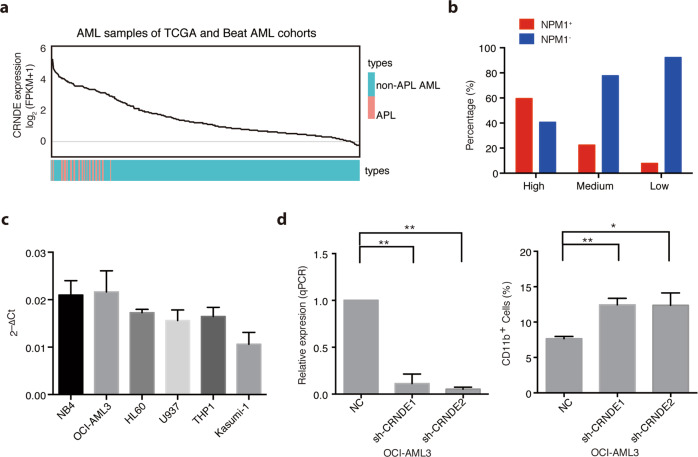
Fig. 5. High expression of CRNDE cooperates with NPM1 mutations to induce leukemogenesis.
a The line chart displays the expression levels of CRNDE in 29 APL (orange) and 350 (blue) samples from the TCGA and Beat AML cohorts in order from high to low. b Bar graph represents the percentage of non-APL AML samples with (NPM1+) or without (NPM1-) NPM1 mutations in groups with high, medium or low expression of CRNDE, respectively. Based on the tertile of CRNDE expression in non-APL AML samples, the patients were divided into three groups: with high expression of CRNDE (n = 116), medium expression of CRNDE (n = 116), and low expression of CRNDE (n = 116). c Relative CRNDE expression was measured by qRT-PCR assays in indicated cells. d The expression levels were detected by qRT-PCR in NPM1-mutant OCI-AML3 cells by transfection of CRNDE shRNAs (left panel). CD11b cell surface expression was detected to determine the differentiated OCI-AML3 cells (right panel). Data represent the mean of three replicates ± s.d. *P < 0.05, **P < 0.01.

