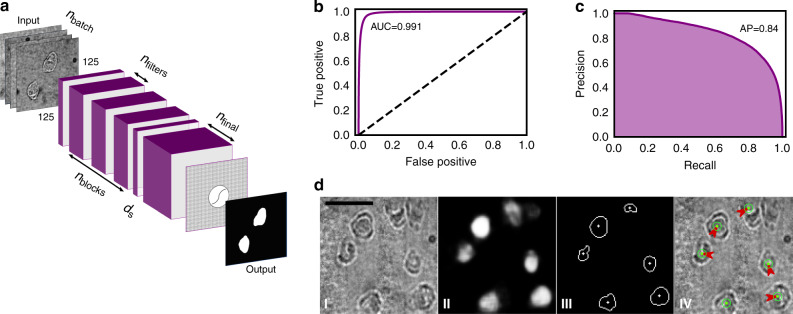
Fig. 2. Artificial Intelligence for cell identification and lysis in the DISCO system.
a Illustration of the architecture of the convolutional neural network (CNN) used for cell localization and segmentation with the image-inputs, prediction outputs, as well as the parameters used for hyper-optimization. The latter include the number of samples in each training batch (nbatch), the number of intermediate blocks (nblocks), the number of filters in each of the intermediate blocks (nfilters), the number of filters in the final layer (nfinal), and the dropout strength used between the intermediate layers and the final layer (ds). Each intermediate block contains 3 convolutional layers, and the images used as input to the network were resized to 125 × 125 px. b Receiver-Operator Characteristic (ROC) curve (purple) for the final hyper-optimized and trained network with area under the curve AUC = 0.991. The dashed line represents a ROC curve for pixel-wise random (i.e., coin-flip) guessing. c Precision-Recall curve for the network with average precision, AP = 0.84. d Representative AI predictions, post-processing, and machine vector instruction generation: (I) brightfield image captured at ×100 magnification and resized and intensity-normalized for input to the network, (II) network output cell position probabilities as pixel intensity values, (III) final cell edge and center positions after 50% probability thresholding and contour center calculation, and (IV) machine vector instructions (red arrows) and laser pulse emissions (green dot and circle) to be automatically executed by the LCL system for lysis of all cells in view. The scale bar is 100 μm.

