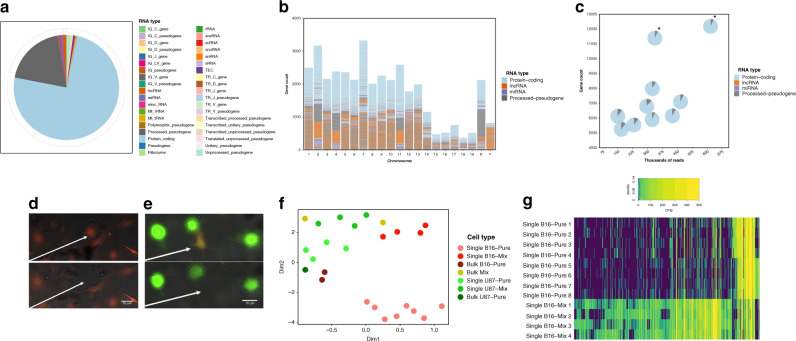
Fig. 4. Single cell transcriptomic analysis using DISCO.
B16 cell or U87 monocultures or U87/B16 co-cultures were loaded onto DISCO devices, where live cells were targeted (1 cell per droplet), lysed, and analyzed according to the transcriptome sequencing pipeline (Supplementary Fig. S10). For comparison, bulk samples of monocultures or co-cultures (~1000 cells) were also evaluated (foregoing the pipeline, analyzed directly by sequencing). a Pie chart showing consolidated gene expression from n = 8 representative single B16 cells binned into the type of RNA the expression originated from b. Plot of the protein-coding RNA (blue), lncRNA (orange), miRNA (purple) and processed pseudogenes (gray) as a function of chromosome for the data-set from a. c Plot of the number of genes detected per cell as a function of aligned reads for the data-set from a, compared to two bulk samples (labeled with asterisks). Each marker is a pie-chart broken into the categories from b. Fluorescence microscopy images of live cells on DISCO devices collected before (top) and after (bottom) laser lysis from (d) a B16 cell monoculture or (e) a co-culture of B16 (red) and U87 (green) cells. White arrows indicate the position of the particular B16 cell selected for lysis. f Plot of UMAP reduction to two dimensions (Dim1 and Dim2) of transcriptomes generated from (i) single B16 cells from monoculture (pink, n = 8) or co-culture (med. red, n = 4), (ii) single U87 cells from monoculture (med. green, n = 4) or co-culture (lt. green, n = 4), and (iii) bulk cells from B16 monoculture (dark red, n = 2), co-culture (yellow, n = 2), or U87 monoculture (dark green, n = 1). g Heat map of gene expression level in counts per million (CPM, with purple-low, yellow-high) of 5300 differentially expressed transcripts (determined by the quasi-likelihood F test, EdgeR) for single B16 cells from monoculture (top 8 rows) and from co-culture (bottom 4 rows); the corresponding list and expression values are found in Supplementary Data 1. The white trace labeled “density” in the legend represents the distribution of the different normalized expression levels in the data-set.

