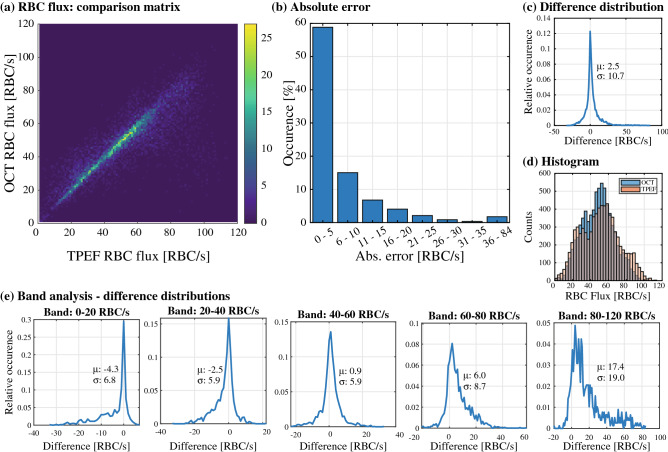
Figure 2.
Evaluation of OCT RBC flux estimation. (a) 2D histogram displaying the estimation of RBC flux in both modalities, highlighting a concentration of measurements on the diagonal. (b) Absolute error between both modalities, binned into steps of 5 RBC/s. (c) Distribution of the differences in estimation for all measurements, with a mean of 2.5 RBC/s and variance of 10.7 RBC/s. (d) Marginal histograms of OCT and TPEF RBC flux estimations, highlighting a bias in OCT RBC flux towards the 20–60 RBC/s band. (e) Band analysis displaying the difference distributions for 5 bands of RBC flux: 0–20, 20–40, 40–60, 80–120 RBC/s.

