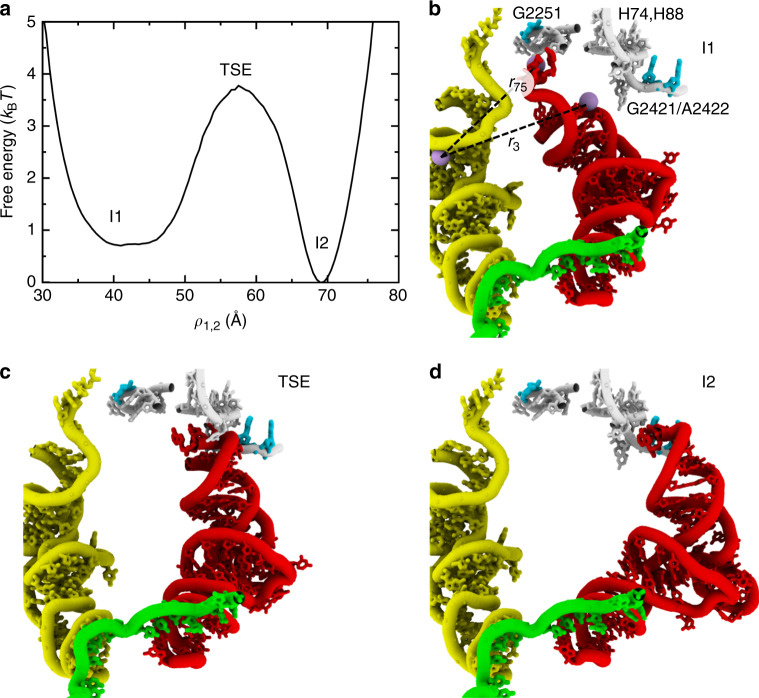
Fig. 4. Identifying the rate-limiting free-energy barrier.
a Since the I1–I2 transition is rate-limiting in the simulations (Supplementary Table 1), we calculated the free-energy as a function of the tRNA position for this step. To specifically describe the I1–I2 transition, the free energy was calculated for simulated frames that were within these ensembles and the associated transition state ensemble (TSE). The I1–TSE–I2 configuration space was defined as 12 Å < RP < 42 Å and 15 Å < RE < 50 Å. The coordinate ρ1,2 was used for analysis, after applying transition path analysis to thousands of possible tRNA coordinates. ρ1,2 is defined as a linear combination of two interatomic distances that monitor the 3′-CCA end (r75) and the acceptor arm (r3). ri is the distance between O3′ atoms of residue i of the P-site tRNA and residue 67 of the A-site tRNA. b Structural snapshot of the I1 ensemble (ρ1,2 ~ 40 Å), rotated relative to Fig. 2. c Representative snapshot of the transition-state ensemble (ρ1,2 ~ 57 Å). Visual inspection would suggest the TSE is characterized by close interactions between the tRNA and H74/H88. d Representative I2 configuration (ρ1,2 ~ 70 Å).

