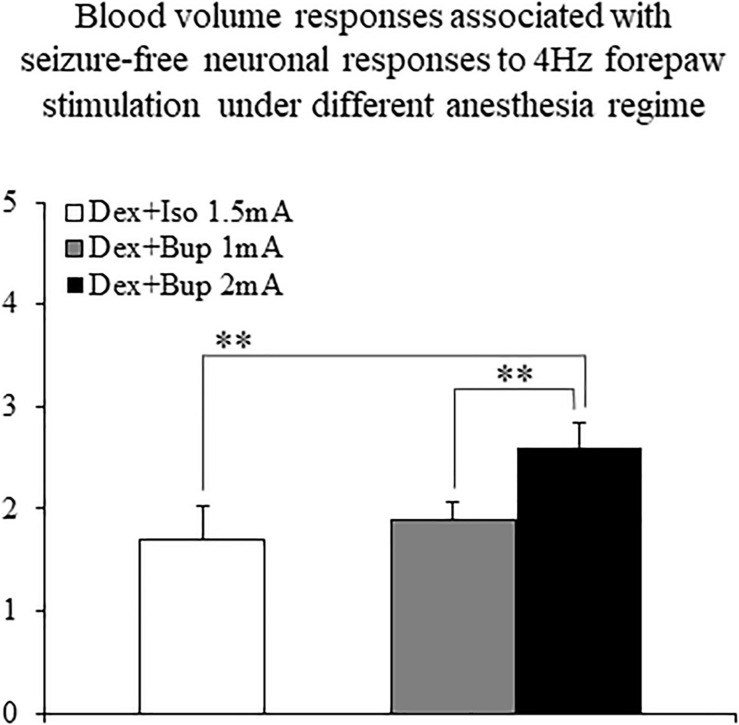
FIGURE 10.
The amplitudes of cerebral blood volume responses associated with seizure-free responses to 4 Hz forepaw stimulation under different anesthesia regimes. A bar graph showing the peak amplitude of CBV normal responses sampled from the gray matter region that showed the highest response. The white bar to the left shows the amplitude of response to stimuli of 1.5 mA administered at 4 Hz under dexmedetomidine and isoflurane anesthesia (Dex + Iso; mean ± SEM, n = 60 trials from 3 SD rats). The gray and black bars show the amplitudes of responses to stimuli of 1.0 mA and 2.0 mA, respectively, administered at 4 Hz under dexmedetomidine and buprenorphine sedation (Dex + Bup; n = 60 trials from the same 3 SD rats). **p < 0.001; Tamhane’s test.

