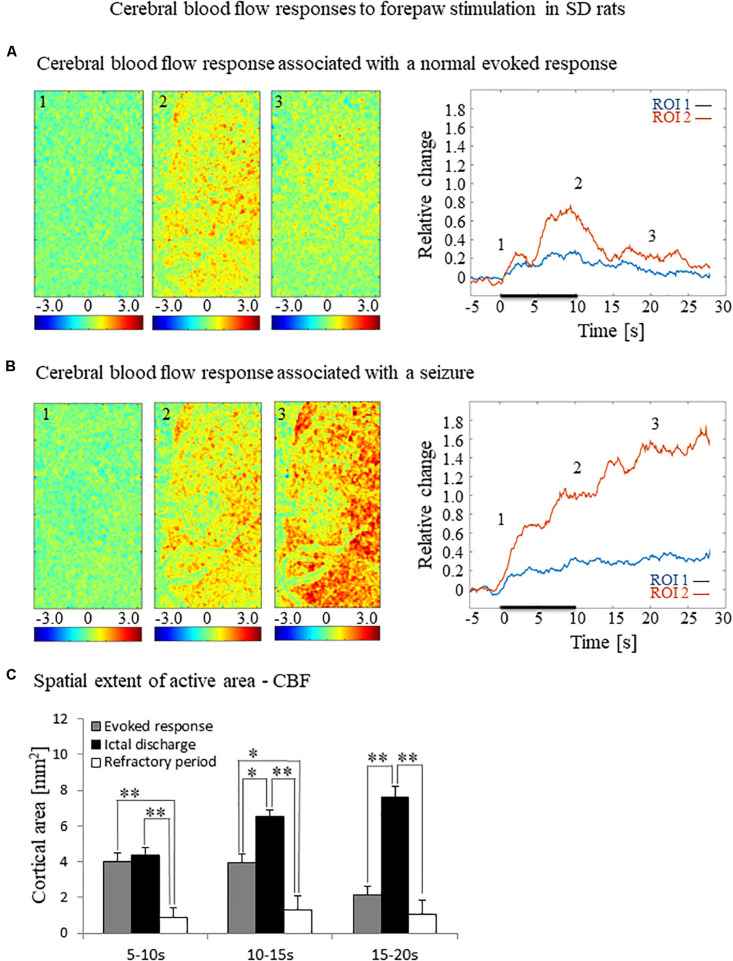
FIGURE 3.
Cerebral blood flow responses evoked by forepaw stimulation. (A) Cerebral blood flow response evoked by stimulation of the contralateral forepaw. To the left, the spatial responses before (the 1 s before stimulus onset), during (9–10 s following stimulus onset), and after (9–10 s following the cessation of the stimulus) the 10 s-long forepaw stimulation period. The reference for obtaining these responses was imaged between 3 and 1 seconds before stimulus onset. Note that positive responses indicated in indexed yellow and red colors represent increases in blood flow. To the right are two time-courses presenting the corresponding temporal responses from two regions (blue and red ROIs in Figure 2C) within the activated area. The stimulation period between 0 and 10 seconds is marked by a dark bar. (B) Maps of the blood flow changes during a response that evoked a seizure, from before, during, and after the 10 s-long forepaw stimulation period (exact time periods are as in A). To the right are two time-courses presenting the corresponding temporal responses from the same ROIs as described in (A). (C) A bar graph showing the spatial extent of the CBF response calculated for the epochs of 5–10 s, 10–15 s, and 15–20 s relative to the onset of the stimulus during normal evoked responses (n = 21), seizure responses (n = 20) and refractory periods (n = 14; *p < 0.05, **p < 0.001; Tamhane’s test).

