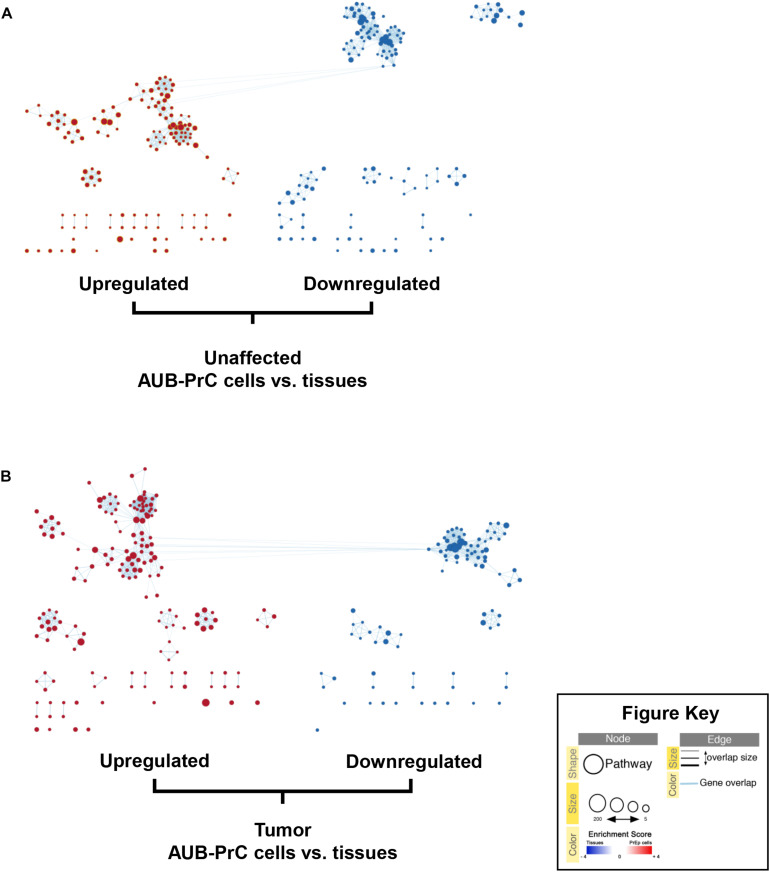
FIGURE 6.
Enrichment maps of pathways enriched in upregulated genes (red) and downregulated genes (blue) in AUB-PrC cells vs. tissues. Enrichment maps of pathways among prostate unaffected (A) and tumor (B) samples were built using EnrichmentMap analysis on Cytoscape 3.7.2 software. Each node (circle) represents a distinct pathway (red representing upregulated pathways and blue representing downregulated pathways), and edges (lines) represent the number of genes overlapping between two pathways, determined using the similarity coefficient.

