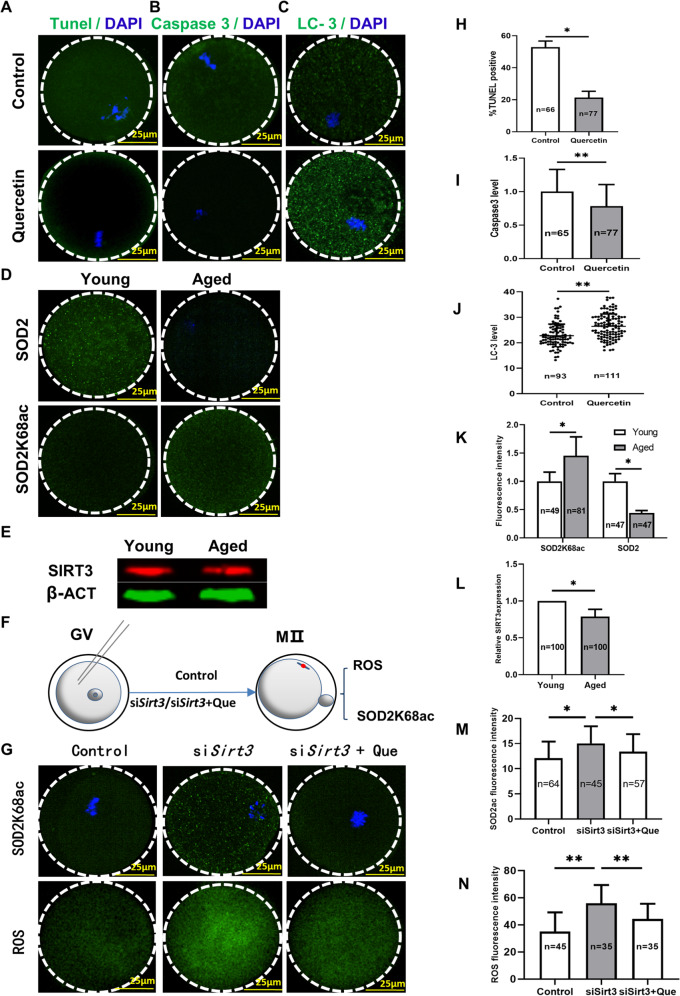
Fig. 5. Quercetin decreases apoptosis and increases anti-oxidative activity via SIRT3-mediated reduction of SOD2K68 acetylation in oocytes from aged mice.
A Confocal images of TUNEL assay examining control and quercetin-treated oocytes. The green fluorescence indicates TUNEL-positive oocytes. Scale bar, 25 μm. B Confocal images showing levels of activated Caspase 3 in control and quercetin-treated oocytes. Scale bar, 25 μm. C Confocal images showing autophagosomes (LC3-II puncta) in control and quercetin-treated oocytes. Scale bar, 25 μm. D Confocal images showing SOD2K68c/SOD2 in young and aged oocytes. Scale bar, 25 μm. E Western blot analysis showed reduced SIRT3 expression in GV stage oocytes from aged mice compared with young mice. β-action served as an internal control. F Schematic illustration of the experimental protocol to determine whether quercetin treatment reduces ROS accumulation levels and increases the extent of SOD2K68 acetylation by Sirt3. G Quercetin lowers the acetylation levels of SOD2K68 acetylation and ROS upon the reduction of SIRT3 expression. Scale bar, 25 μm. H The percentage of TUNEL-positive oocytes in control and quercetin-treated oocytes. I The Caspase3 was determined by immunofluorescence in control and quercetin-treated oocytes. J Quantification of LC3 intensity in control and quercetin-treated oocytes. K The levels of SOD2K68 are negatively associated with SOD2 enzymatic activity in M II stage oocytes from aged mice and young mice. L Western blot analysis showed the reduced Sirt3 expression in oocytes from aged mice compared with young mice. M Quantitative analysis of fluorescence intensity showing the acetylation levels of SOD2K68 after injecting Control, siSirt3, and siSirt3 + Quercetin treatment (Que). N Quantitative analysis of ROS fluorescence intensity after injecting Control, siSirt3, and siSirt3 + Quercetin treatment (Que). DNA was stained with DAPI. Data are means ± SD of at least three independent experiments. Differences between two groups were analyzed by two-tailed unpaired Student’s t-tests. Multiple comparisons between more than two groups were analyzed by one-way ANOVA test. *P < 0.05 vs. control; **P < 0.01 vs. control as calculated by two-tailed unpaired Student’s t-tests.

