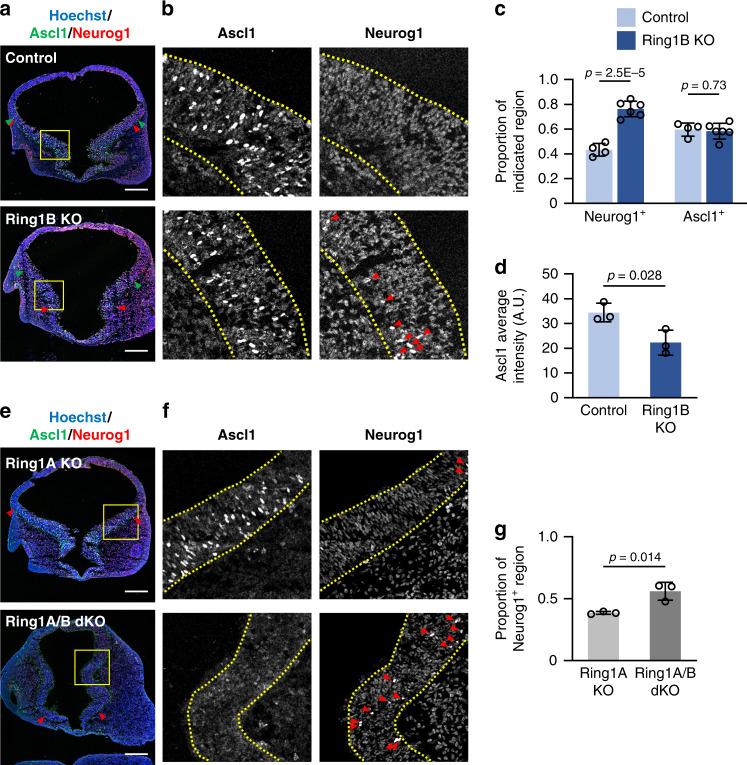
Fig. 3. Deletion of Ring1 confers dorsalized expression patterns of proneural genes in the ventral telencephalon.
a, b, e, f Coronal sections of the brain of control and Ring1B KO mice (a) or of Ring1A KO and Ring1A/B dKO mice (e) at E10 were subjected to immunohistofluorescence staining with antibodies to Neurog1 and to Ascl1. Nuclei were counterstained with Hoechst 33342. The regions indicated with yellow outlined squares (250 by 250 µm in (a), 300 by 300 μm in (e)) are shown at higher magnification in (b) and (f), respectively. Red arrowheads in ((a) and (e) and green arrowheads in a represent the ventral and dorsal border of Neurog1+ and Ascl1+ regions, respectively. The telencephalic wall is demarcated by yellow dotted lines in (b) and (f). Red arrowheads in (b) and (f) indicate Neurog1+ cells. Scale bars, 200 μm. c, d Neurog1+ perimeter length or Ascl1+ perimeter length was determined as a proportion of total perimeter length for the telencephalic wall of control and Ring1B KO mice (c). The average of Ascl1 immunostaining intensity within Ascl1+ cells in the LGE was also determined for each section and then corrected for the intensity in the dorsal telencephalon (d). Data are means ± s.d., n = 4 control and n = 6 Ring1B KO mice (c) or n = 3 control and Ring1B KO mice (d), two-tailed Student’s unpaired t test. g Neurog1+ perimeter length of Ring1A KO and Ring1A/B dKO embryos was determined as in c. Data are means ± s.d., n = 3 embryos of each genotype, two-tailed Student’s unpaired t test. Source data are provided as a Source Data file.

