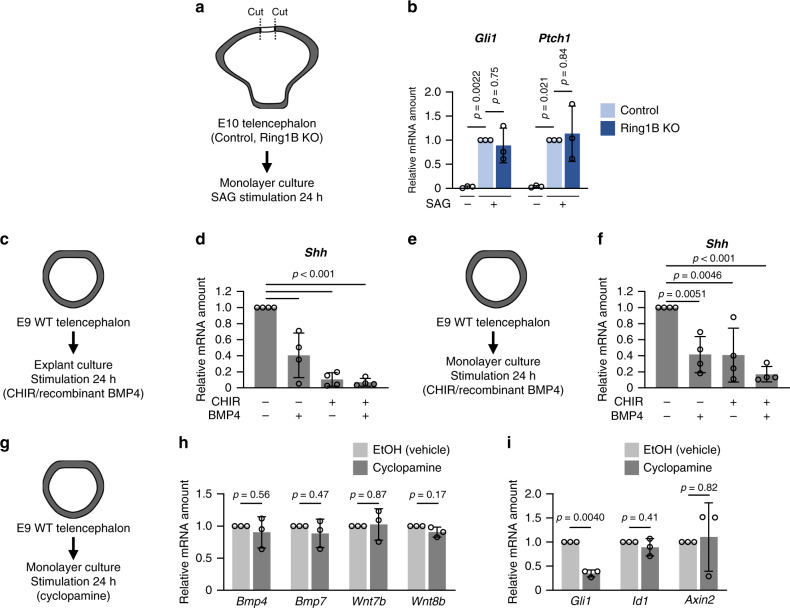
Fig. 7. Forced activation of BMP and Wnt signaling inhibits Shh expression.
a Cells from the telencephalon (outside of the dorsal midline) of control or Ring1B KO mice at E10 were maintained in monolayer culture for 6 h and then exposed for 24 h to 2 μM SAG or dimethyl sulfoxide vehicle. b RT-qPCR analysis of relative Gli1 and Ptch1 mRNA abundance (normalized by the amount of Actb mRNA) in NPCs treated as in (a). Data are means ± s.d., n = 3 independent experiments, one-way ANOVA followed by Dunnett’s multiple-comparison test. c, e The telencephalon of WT (ICR) mice at E9 was maintained in explant (c) or monolayer (e) culture for 6 h before exposure for an additional 24 h to BMP4 (50 ng/ml) or 5 μM CHIR-99021. d, f RT-qPCR analysis of relative Shh mRNA abundance (normalized by the amount of Actb mRNA) in NPCs treated as in (c) and (e), respectively. Data are means ± s.d., n = 4 independent experiments, one-way ANOVA followed by Dunnett’s multiple-comparison test. g The telencephalon of WT (ICR) mice at E9 was maintained in monolayer culture for 6 h before exposure for an additional 24 h to 1 μM cyclopamine or ethanol (EtOH) vehicle. h, i RT-qPCR analysis of relative Bmp4, Bmp7, Wnt7b, or Wnt8b (h) or Gli1, Id1, or Axin2 (i) mRNA abundance (normalized by the amount of Actb mRNA) in NPCs treated as in (g). Data are means ± s.d., n = 3 independent experiments, two-tailed Student’s paired t test. Source data are provided as a Source Data file.

