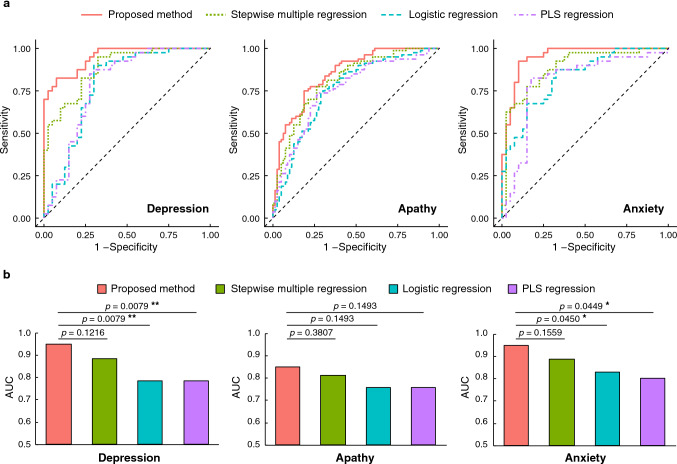
Figure 2.
Results of ROC analysis obtained by ten-fold cross-validation. The red, green, blue, and purple lines/bars represent the proposed method, stepwise multiple regression, logistic regression, and partial least squares (PLS) regression, respectively. (a) ROC curve for each model. (b) AUC value for each model. Statistical test results obtained using the DeLong test for two correlated ROC curves with the Holm adjustment are also shown (* ; ** ).

