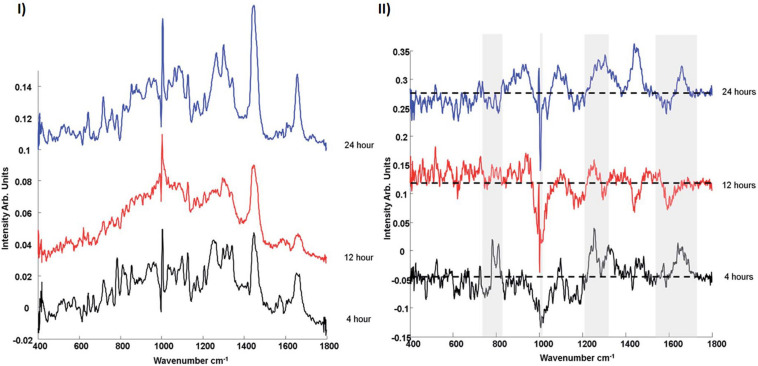
FIGURE 3.
(I) Comparison of mean spectra of 4, 12, and 24 h nanoparticle exposure data sets. (II) Comparison of PCA loadings of 4, 12, and 24 h nanoparticle exposure data sets. Spectra are offset for clarity. The dotted line represents the ‘0’ line for each loading (Efeoglu et al., 2015).

