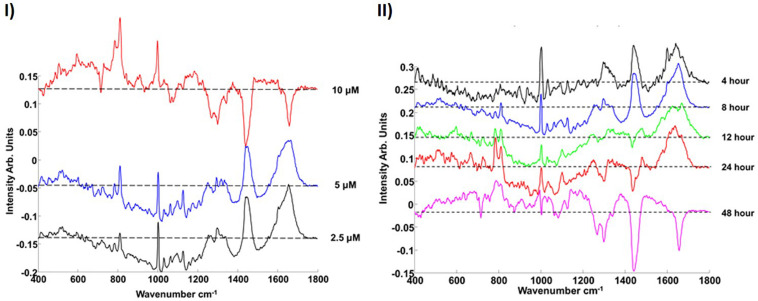
FIGURE 6.
(I) Loadings of PC1 for pairwise analysis of cytoplasm of PS-NH2 exposed cells with the control for 10 μM (red), 5 μM (blue), and 2.5 μM (black) after 8 h exposure. (II) Comparison of the Loading of PC1s for different (2.5 μM) PS-NH2 exposure times (cytoplasm). 4, 8, 12, 24, and 48 h are indicated with black, blue, green, red, and magenta, respectively. The dotted line represents the zero ‘0’ point for each loading. Loadings are offset for clarity. Positive features of the PCs are related to exposed cells while negative features of the PCs are related to their controls (Efeoglu et al., 2016).

