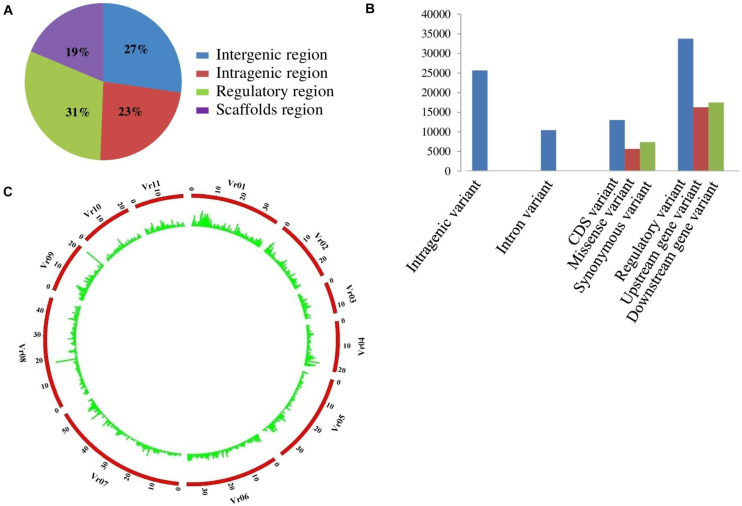
FIGURE 1.
(A) Distribution of SNPs in different genomic regions. (B) Distribution of large effect SNPs in different genie regions. (C) A Circos circular ideogram depicting the genome wide distribution. The outermost circle represents the eleven mungbean chromosomes, while the inner circle represents the relative distribution of SNPs mined from 144 diverse genotypes in mungbean.

