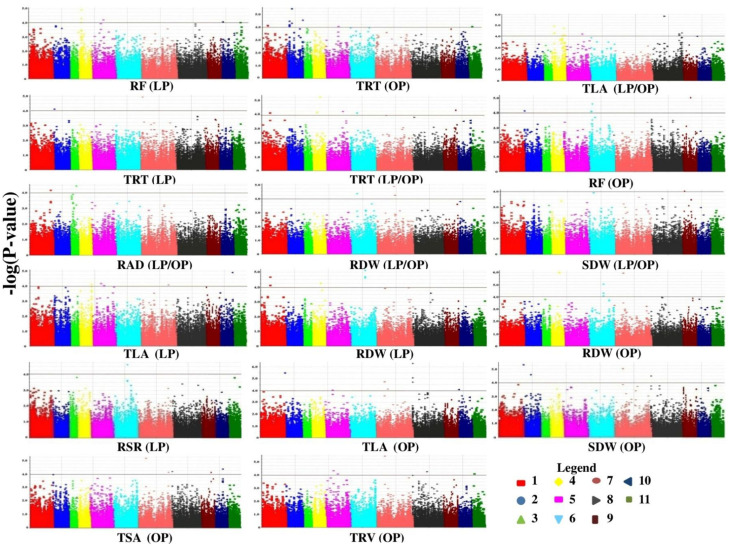
FIGURE 5.
Manhattan plots showing significant p-values (measured with mixed linear model) for Phosphorus use efficiency traits associated with 13 putative candidate genes. Colors indicate different chromosomes while horizontal lines indicate a common significance level of p = 0.0001 [–log(p) = 4.0]. RF, root forks; TRT, total root tips; TLA, total leaf area; RAD, root average diameter; RDW, root dry weight; SDW, shoot dry weight; RSR, root to shoot ratio; TSA, total root surface area; TRV, total root volume; LP, low phosphorus condition; OP, optimum phosphorus condition; LP/OP, ratio of low phosphorus to optimum phosphorus condition.

