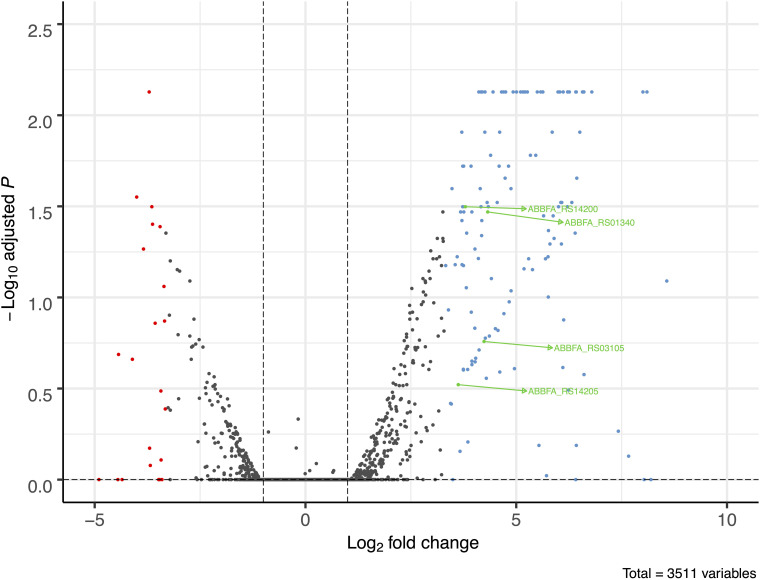
FIGURE 2.
Volcano plot of transcriptome analysis of AB307-0294 and its BfmR-deficient derivative AB307.70 (ΔbfmR). The ratio of RNA abundance in AB307-0294/AB307.70 (ΔbfmR) was calculated and plotted as log2-fold change. The dashed vertical lines left of zero marks a log2- fold change of -1 and the dashed line right of zero shows marks a log2 fold-change greater than 1, corresponding to a fold change of 0.5 and 2, respectively. A total of 3511 genes were assessed, those upregulated >10-fold are marked in blue, those downregulated >10-fold are marked in red, and those of interest for this study are marked in green, ABBFA_RS14200 (bfmS), ABBFA_RS01340 (mapA), ABBFA_RS03105 (oprB), and ABBFA_RS14205 (bfmR). The plot was generated using R package version 1.4.0, https://github.com/kevinblighe/EnhancedVolcano.

