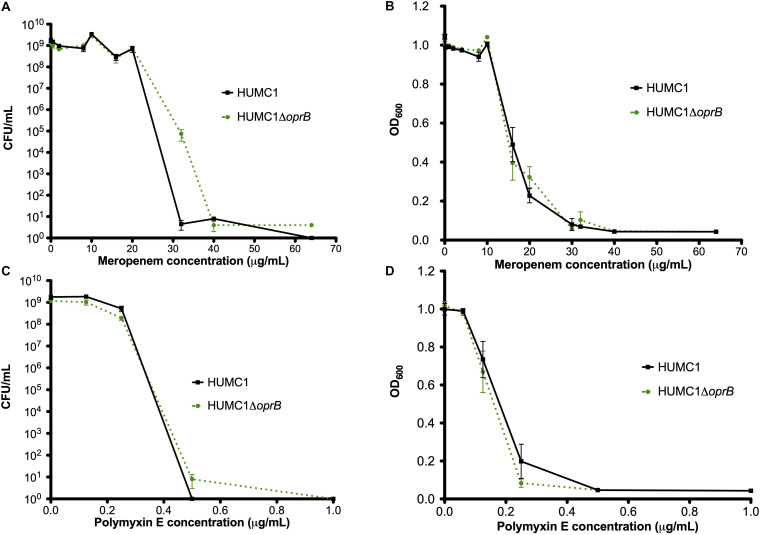
FIGURE 5.
Comparison of the growth/survival of HUMC1 and HUMC1ΔoprB in in Mueller Hinton II cation-adjusted medium when exposed to various concentrations of meropenem (0–64 μg/mL, panels (A) [CFU/mL] and (B) [optical density at 600 nm]) and polymyxin E (0–1.5 μg/mL, panels (C) [CFU/mL] and (D) [optical density]) after 18 h incubation at 37°C. Data are means ± SEM, n = 3 for experiments measuring CFU and n = 12 for experiments measuring optical density. P = 0.0625, P = 0.5995, P = 0.7396, and P = 0.2092, respectively, with comparisons by unpaired t test of log-transformed AUC for experiments measuring CFU/mL and of AUC for experiments measuring optical density.

