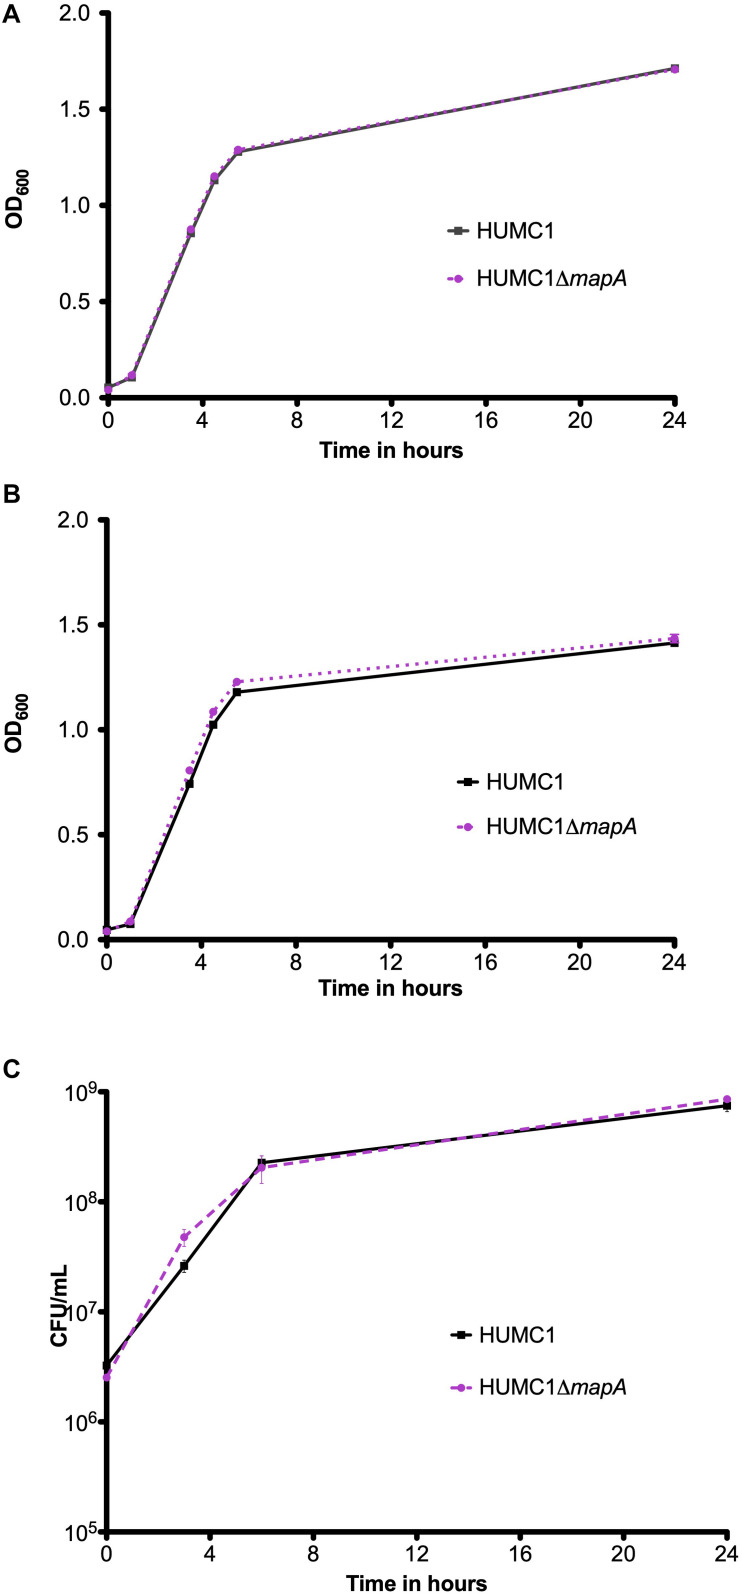
FIGURE 6.
Growth comparison of HUMC1 and HUMC1ΔmapA in lysogeny broth (panel A), minimal medium (panel B), and human ascites fluid (panel C). Data are means ± SEM, n = 3, P = 0.7055, P = 0.0699, and P = 0.8647, respectively, with comparisons by unpaired t test of log-transformed AUC for experiments measuring CFU/mL and of AUC for experiments measuring optical density.

