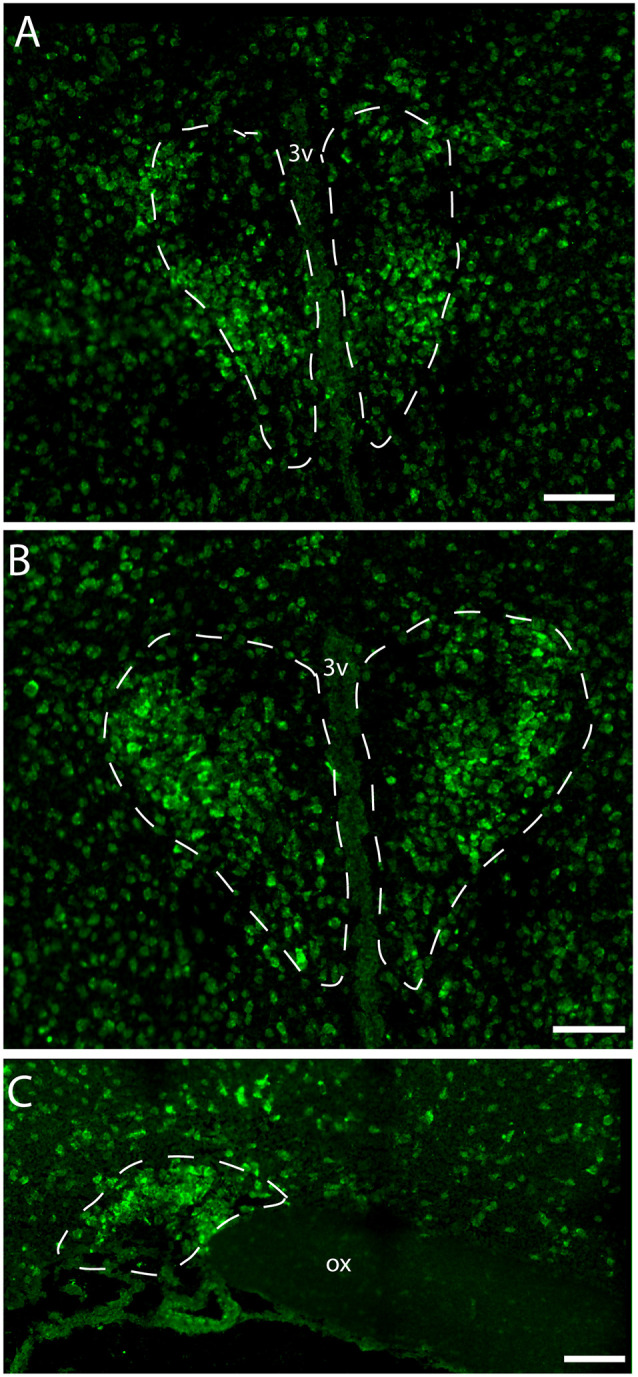
Figure 2.

Distribution of VPAC1 mRNA in the rostral and mid PVN (A,B) and SON (C) using a digoxiginin-labeled cRNA probe. Dashed lines indicate in (A,B) the rostral and mid PVN, respectively, and (C) the SON. Ox. optic chiasm; 3v, third ventricle. Scale bars: (A–C) = 100 μm.
