
Figure 4.
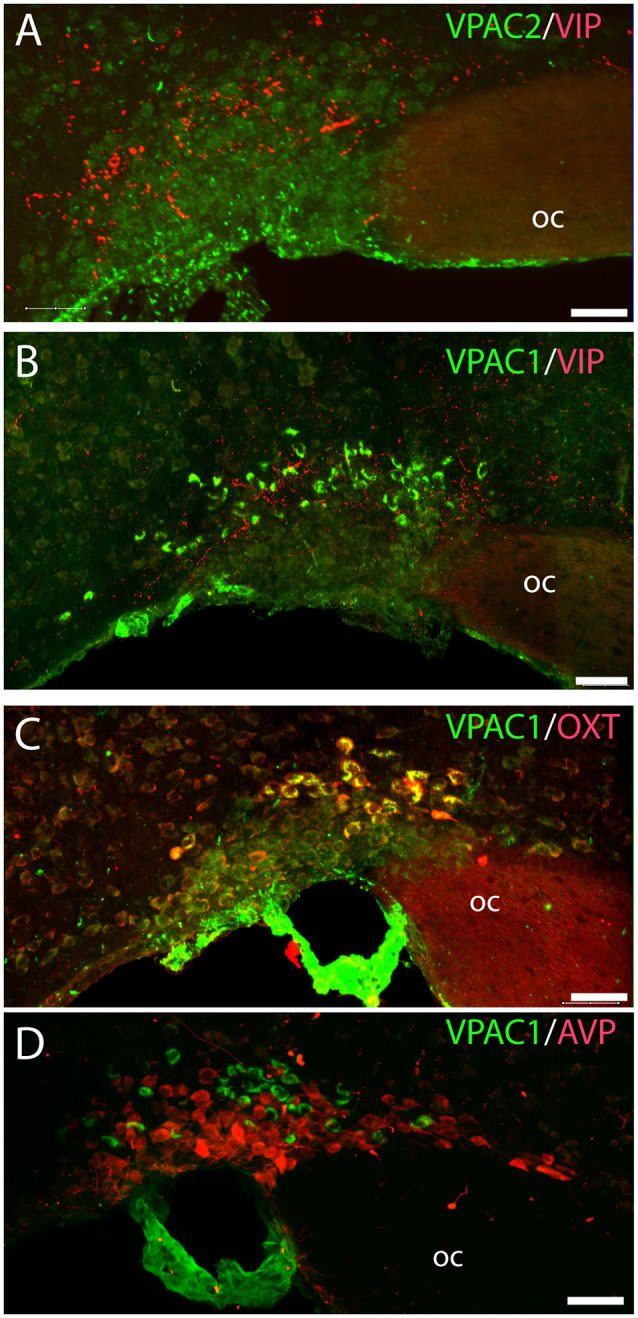
Distribution of VIP (red), VPAC1 (green), VPAC2 (green), OXT (red), and arginine vasopressin (AVP; red) immunoreactivity in the SON. VPAC2 (green) was not visualized in the SON (A). VIP and VPAC1 immunoreactivity were found in the SON (B). VPAC1 (green) was also found in the cerebral blood vessel surrounding the SON (C,D). A Z-stack of high-resolution images used for 3D reconstruction showed colocalization of VPAC1 (green) and OXT (red) visualized as yellow in (C). AVP and VPAC1 immunoreactivity was found in the SON; 3D reconstruction showed them to be localized in separate neurons. Images (A–D) represent maximal projections of 16 digital sections in a Z-stack (Z = 2 μm). Scale bars: (A–D) = 25 μm.