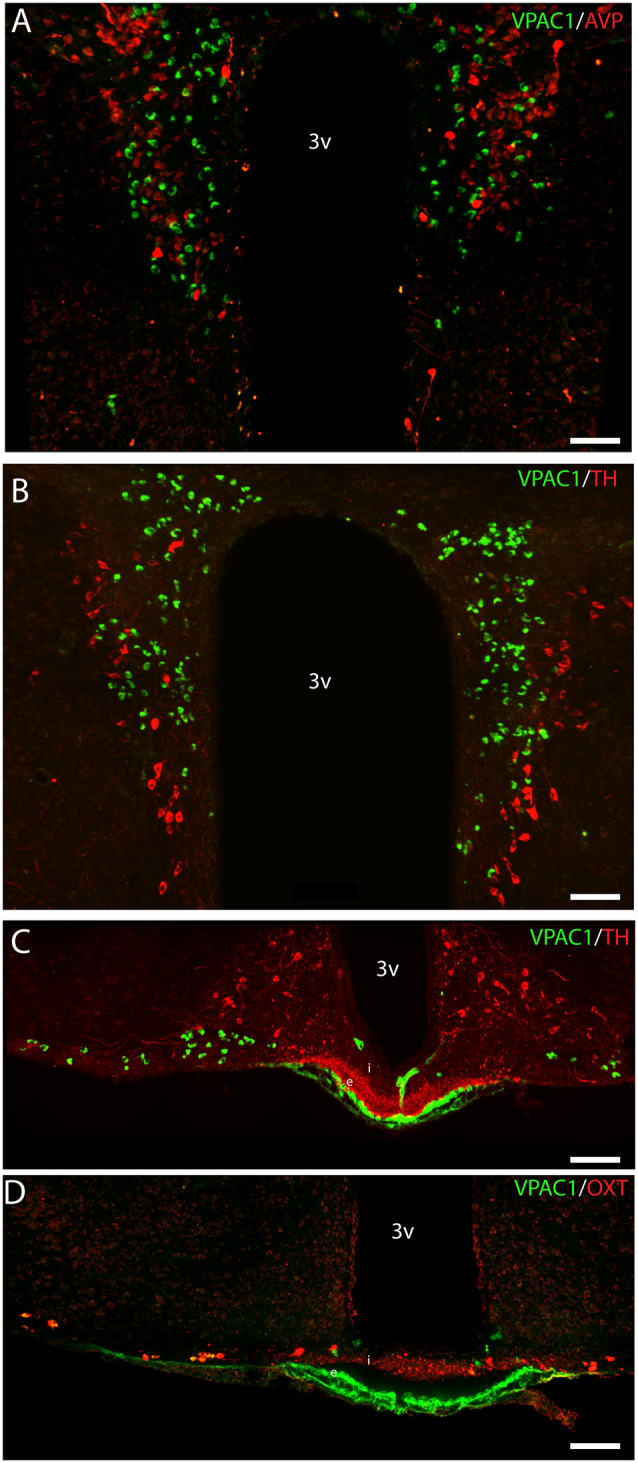
Figure 5.

Distribution of VPAC1 (green), tyrosine hydroxylase (TH; red), OXT (red), and AVP (red) in the PVN and median eminence (ME). VPAC1 (green), TH (red), and AVP (red) immunoreactivity were found in the PVN (A,B) showing no colocalization. TH (red) was found in the external layer of the ME (C), whereas OXT (red) was found in the internal layer (D). VPAC1 (green) immunoreactivity was seen in relations to the portal blood vessel (C,D), as an indicator of VPAC1 expression on the smooth muscle cells of the cerebral blood vessels but was not colocalized with TH or OXT neurons in the ME. Images (A–D) represent maximal projections of 16 digital sections in a Z-stack (Z = 2 μm). Scale bars: (A,B) = 80 μm; (C,D) = 100 μm.
