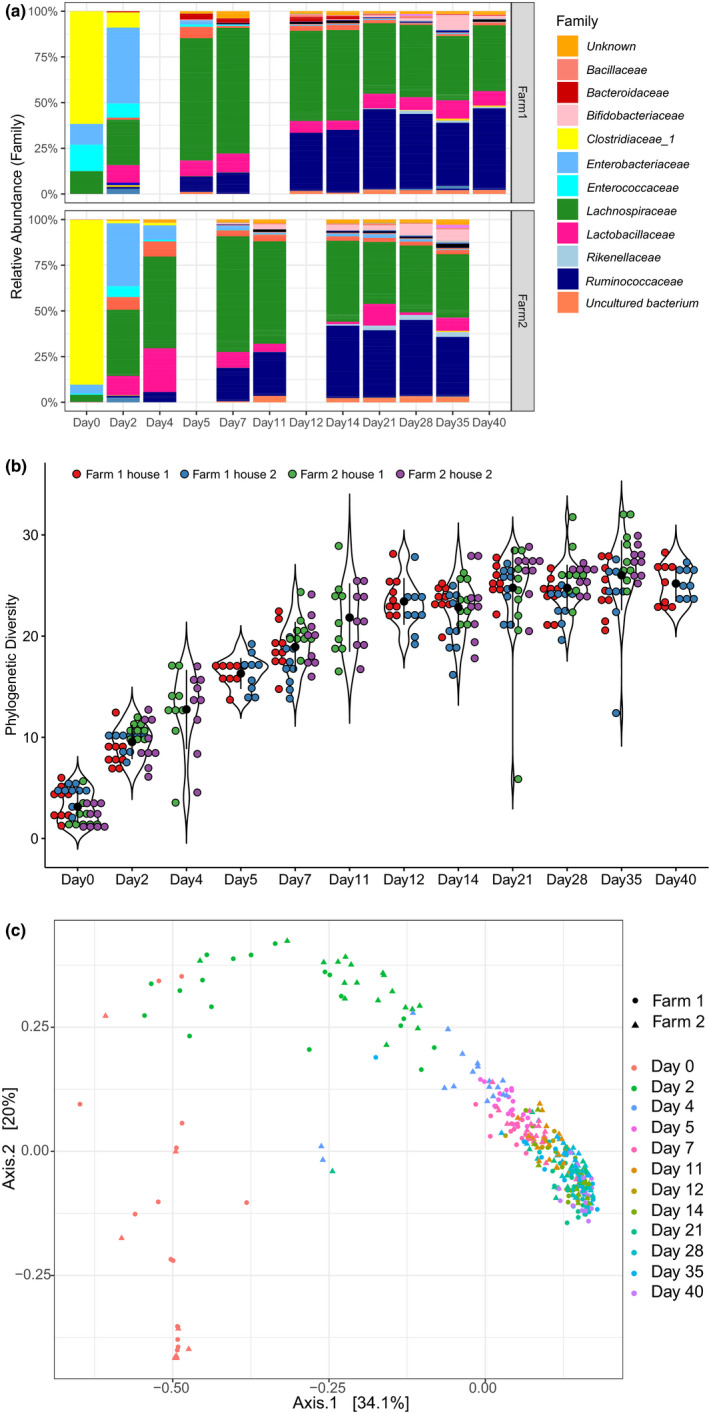
FIGURE 4.

Development of cecal microbiota composition. (a) Development of cecal microbiota in Farm 1 (top panel) and Farm 2 (bottom panel) at the family level. For each time point, data from 18 animals were included (9 animals per house). (b) Phylogenetic diversity per flock increased with broiler age (n = 342) until day 21 (pairwise Wilcoxon rank‐sum test, adjusted p‐value of q < .05). (c) Analysis of beta diversity using principal coordinate analysis based on weighted UniFrac distances. Farm and sampling time are indicated as variables
