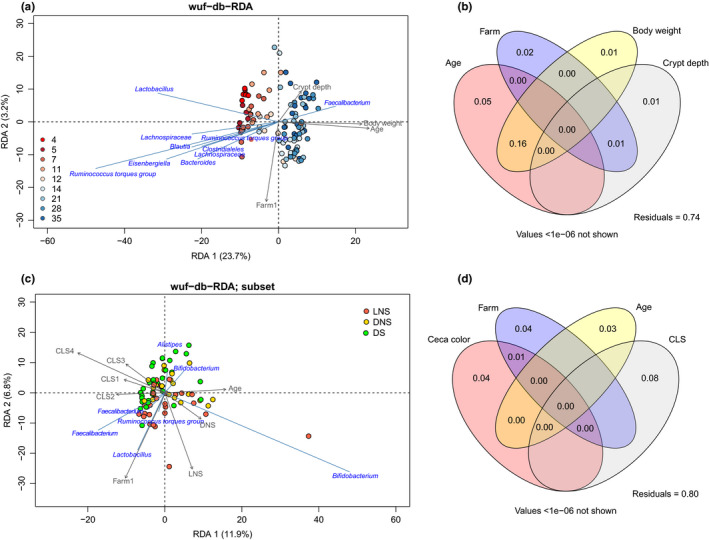
FIGURE 5.

Weighted UniFrac distance‐based RDA and variation partitioning. (a) Triplot for weighted UniFrac distance‐based redundancy analysis (WUF‐db‐RDA) of cecal microbiota composition on the ASV level. The longer the arrow, the stronger the correlation. Samples are colored by age (n = 111 broilers), and taxonomic labels are on the lowest know level. (b) Venn diagram visualizing the variation partitioning of WUF‐db‐RDA and showing a strong overlap between age and body weight (16%). (c) Triplot WUF‐db‐RDA of subset broilers with ages 21, 28, and 35. In this dataset, only cecal color, farm, age, and CLS are significant (n = 81 broilers). Points are colored by cecal color (LNS, light without stripes; DNS, dark without stripes; DS, dark with stripes; no light‐colored ceca with stripes were observed). (d) Venn diagram visualizing the variation partitioning of the WUF‐db‐RDA subset and showing no overlap between the explanatory variables
