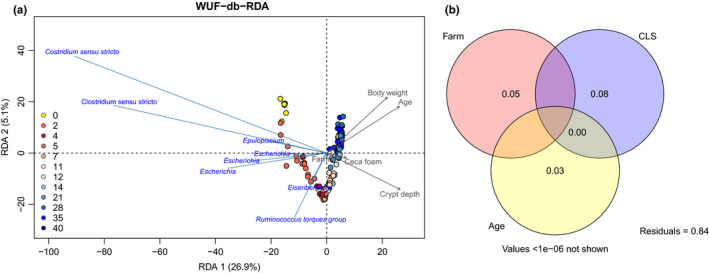
FIGURE A2.

Weighted UniFrac‐db‐RDA of cecal microbiota composition. riplot for weighted UniFrac‐db redundancy analysis (WUF‐db‐RDA) of cecal microbiota composition. The longer the arrow, the stronger the correlation. (a) All time points included in the model. (b) The Venn diagram displaying the variation partitioning of the WUF‐db‐RDA subset showed no overlap between the explanatory variables farm, coccidiosis lesion scores (CLS), and age (n = 148 broilers)
