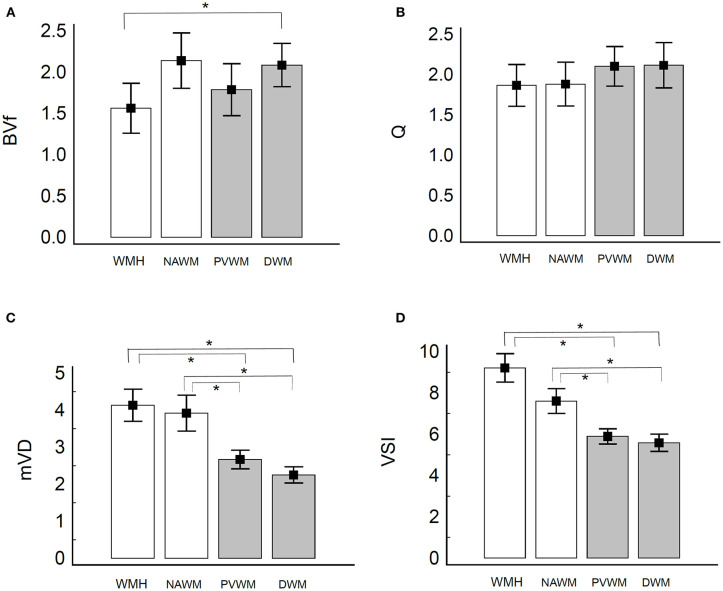
Figure 2.
Bar graph of microvessel parameters of white matter in patients with SVaD and healthy controls. Vertical lines represent the standard deviation. (A) BVf, (B) Q, (C) mVD, and (D) VSI. The white bar presents value in patients with SVaD and the gray bar presents in the value in healthy controls. *indicate statistically significant differences (P < 0.05). The BVf is significantly lower in WMH of SVaD compared to DWM of the controls (A). The Q value of white matter was not significantly different between the two groups (B). The mVD and VSI of white matter are significantly higher in SVaD patients compared to controls regardless of the location (C,D).

