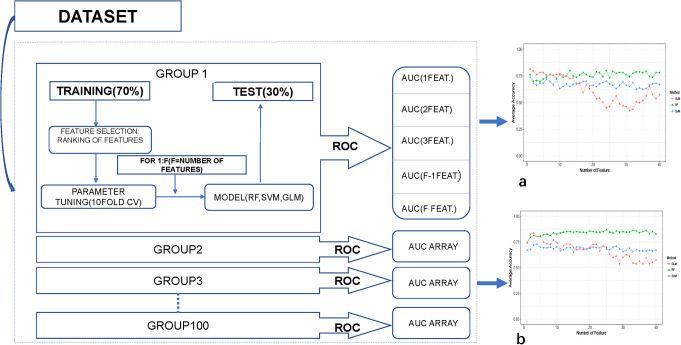
Figure 2.
Scheme of the nested cross validation method used to evaluate the different datasets of features. Texture data extracted from the PTC images were randomly divided into training and test sets N = 100 times to evaluate the 3 model using different of samples to obtain averaged results (a) T2WI-FS images with the average accuracy, (b) T2WI images with the average accuracy. Changes of average accuracy with the increase in feature number during feature selection.

