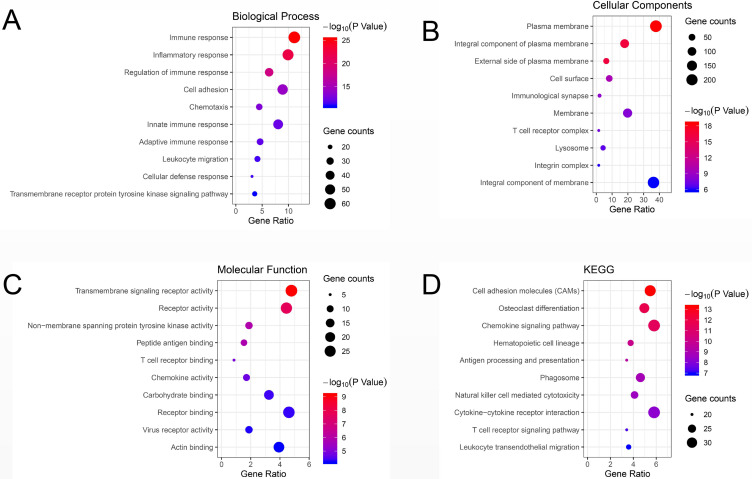
Figure 3.
Bubble plot of the top 10 GO terms and KEGG enrichment pathways of DEGs. (A) GO analysis of DEGs in the biological process category. (B) GO analysis of DEGs in the cellular component category. (C) GO analysis of DEGs in the molecular function category. (D) KEGG enrichment analysis of DEGs. A higher gene ratio represents a higher level of enrichment. The size of the dot indicates the number of target genes in the pathway, and the color of the dot reflects the P-value range.

