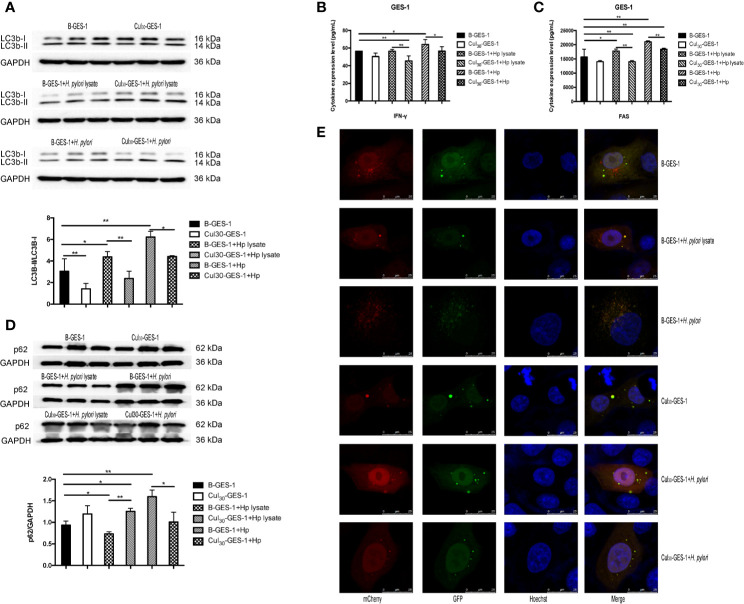
Figure 3.
The treatment of H. pylori lysate inhibits autophagy of GES-1 cells. Cul30-GES-1 and B-GES-1 cells were challenged with H. pylori lysate (2 μg/mL) or H. pylori (6×10⁶ CFU/mL) for 24 h, and the expression of LC3b-II/LC3b-I (A) and p62 (D) in Cul30-GES-1 and B-GES-1 cells exposed to H. pylori lysate or H. pylori were detected by western blot. The expression of IFN-γ (B) and FAS (C) were measured by Luminex assays. (E) Representative fluorescence images of autophagosomes and autolysosomes in GES-1cells treated with H. pylori lysate using the tandem mCherry-EGFP-LC3 fusion protein assay. The autophagy flux was evaluated by the ratio of red spots to yellow spots. The yellow spots indicate autophagosomes, while the red spots indicate autolysosomes. If the phagosome and lysosome fuses normally, then the red fluorescence is greater than the yellow fluorescence. If downstream autophagy is blocked, the phagosome and lysosome cannot fuse normally, and then yellow fluorescence is the main color visualized. n=3. *p < 0.05, **p < 0.01.

