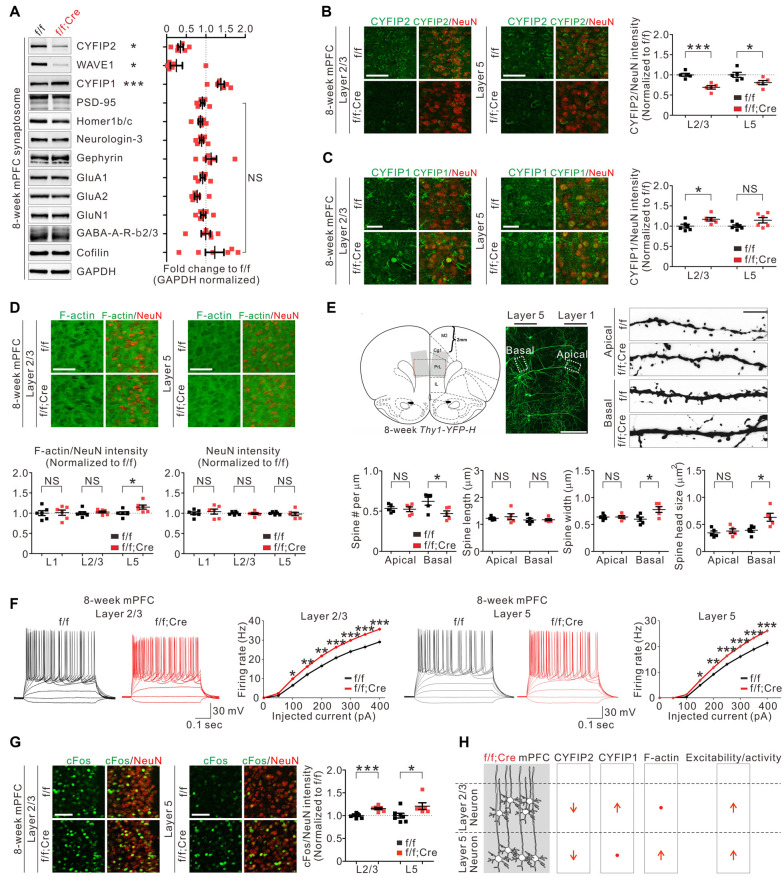
Figure 2.
Molecular, morphological, and functional changes in excitatory pyramidal neurons in the medial prefrontal cortex (mPFC) of Cyfip2 cKO mice. (A) Western blot analysis of various synaptic proteins in the mPFC synaptosome of Cyfip2 cKO mice (n = 6 animals per genotype, two-tailed student’s t-test). NS, not significant. (B) Fluorescence immunohistochemistry (IHC) analysis of CYFIP2 and NeuN in the mPFC of Cyfip2 cKO mice (n = 5 animals per genotype, two-tailed student’s t-test). Scale bar, 50 μm. L2/3, layer 2/3; L5, layer 5. (C) Fluorescence IHC analysis of CYFIP1 and NeuN in the mPFC of Cyfip2 cKO mice (n = 6 animals per genotype, two-tailed student’s t-test). Scale bar, 25 μm. (D) Fluorescence IHC analysis of F-actin and NeuN in the mPFC of Cyfip2 cKO mice (n = 6 animals per genotype, two-tailed student’s t-test). L1, layer 1. Scale bar, 50 μm. (E) Dendritic spine analysis of layer 5 pyramidal neurons in the mPFC of Cyfip2 cKO mice (n = 5 animals per genotype, two-tailed student’s t-test). Scale bars, 200 and 5 μm. (F) Intrinsic excitabilities of mPFC L2/3 (left panel) and L5 (right panel) neurons measured as firing rates against injected current (n = 4 animals per genotype, two-tailed student’s t-test). (G) Fluorescence IHC analysis of cFos and NeuN in the mPFC of Cyfip2 cKO mice (n = 7 animals for control and 6 for Cyfip2 cKO, two-tailed student’s t-test). Scale bar, 50 μm. (H) Summary of molecular and functional changes of pyramidal neurons in the mPFC of Cyfip2 cKO mice. All data are presented as mean ± SEM. *P < 0.05; **P < 0.01; ***P < 0.001.

