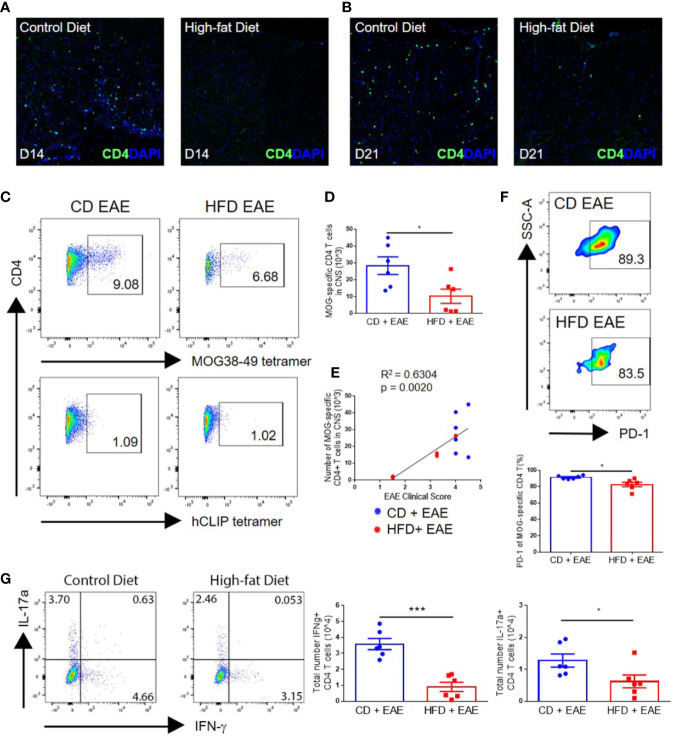
Figure 2.
Impaired EAE clinical course in diet-induced obesity is associated with decreased numbers of antigen-specific T cells in the CNS. (A–G) C57BL/6 male mice were placed on CD or HFD for 6–7 months and induced with EAE. (A, B) IHC staining of CD4+ T cells in the spinal cord on day 14 and day 21 post-immunization in control mice and DIO mice. (C) Representative flow plots of MOG38-49 tetramer staining of CD4+ T cells in CNS. (D) Numbers of MOG38-49 tetramer+ CD4+ T cells in CNS on day 18 post-immunization. (E) Numbers of MOG38-49 tetramer+ CD4+ T cells in CNS versus EAE clinical score on day 18 post-immunization. (F) Representative flow plots and percentage of MOG-specific CD4+ T cells expressing PD-1. (G) Representative flow plots of IFN-γ and IL-17α expression in CD4+ T cells in the CNS. Numbers of IFN-γ+ CD4+ T cells and IL-17α+ CD4+ T cells in the CNS on day 18 p.i. Bar graphs depict mean ± SEM. Sample size n = 6/group from two separate experiments. Two-tailed unpaired Student’s t-test used to compare two groups. *p < 0.05, ***p < 0.001.

