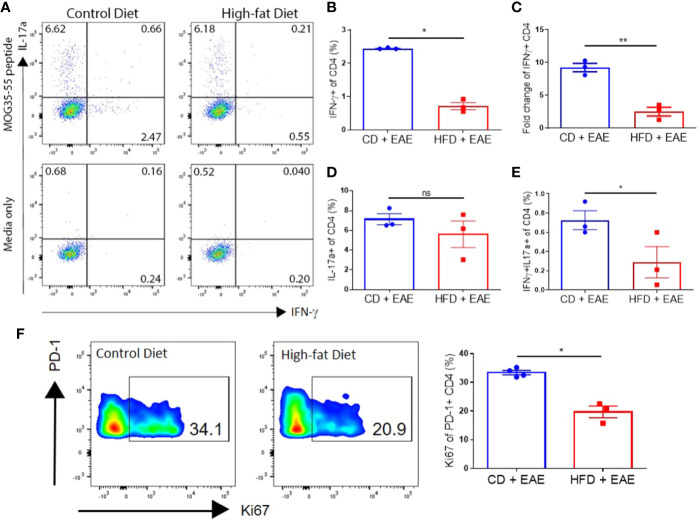
Figure 4.
DIO mice have reduced MOG-specific T cells in secondary lymphoid organs after immunization. (A–F) C57BL/6 male mice were placed on CD or HFD for 6–7 months and induced with EAE. SLOs were harvested on day 8 p.i. (A) Representative flow plots of IFN-γ+ and IL-17α+ expressing by CD4+ T cells pulsed with or without 50 μg/ml MOG peptide for 48 h (MOG peptide recall assay). (B) Percentages of CD4+ T cells expressing IFN-γ (Th1) in MOG peptide recall assay. (C) Fold change in IFN-γ expression with MOG peptide pulse over media. (D) Percentages of CD4+ T cells expressing IL-17α (Th17) in MOG peptide recall assay. (E) Percentages of CD4+ T cells expressing both IFN-γ- and IL-17α (Th1/Th17) in MOG peptide recall assay. (F) Representative flow plots and quantification of percentage of PD-1+ CD4+ T cells expressing Ki67. Sample size n = 3–4/group; representative of two independent experiments. Bar graphs depict mean ± SEM. One-way analysis of variance (ANOVA) with Tukey’s post hoc test for comparison of three or more groups. Two-tailed unpaired Student’s t-test used to compare two groups. *p < 0.05, **p < 0.01.

