FIGURE 3.
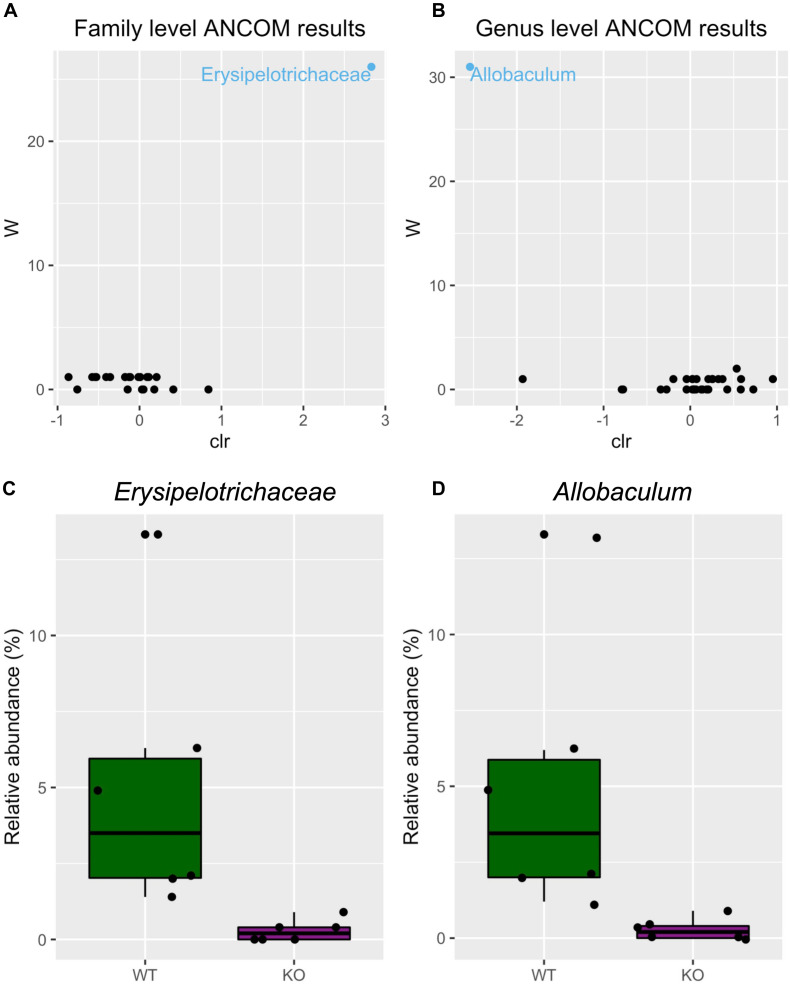
Differential microbiota abundance in mGlu5 KO mice. Volcano plot for the analysis of composition of microbiomes (ANCOM) test for (A) family and (B) genus level. Only significant bacterial taxa are labeled and colored in blue. Significant taxa are showing high w-stats. Boxplots comparing the relative abundance of the family and genus whose abundance was found to differ significantly between mGlu5 KO and WT (C) Erysipelotrichaceae and (D) Allobaculum. The plots show mean ± SEM (n = 6 for both WT and mGlu5 KO mice groups).

