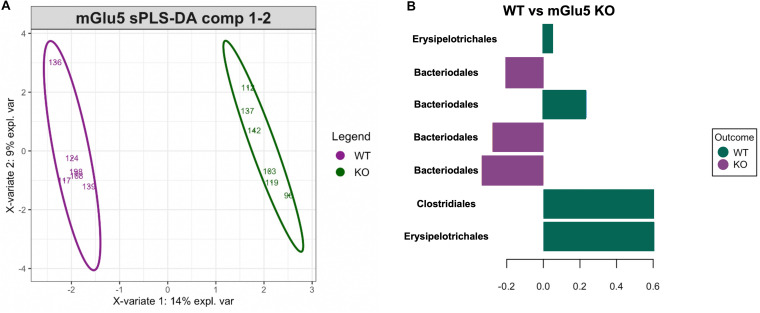
FIGURE 4.
Identification of a bacterial signature discriminating the genotypes with sPLS-DA. (A) Sample plots with 0.95 confidence ellipse plots for WT and mGlu5 KO show a strong discrimination between genotypes. The top 7 resulting bacterial signature contributing to component 1 is displayed in (B). The length of the bars indicates the importance of each amplicon sequence variants (ASVs) (at the Order taxonomic rank) in the signature (from bottom to top: decreasing importance) with color indicating the phenotype group with maximum median abundance (n = 6 for both WT and mGlu5 KO mice groups, classification error rate = 0.11).

