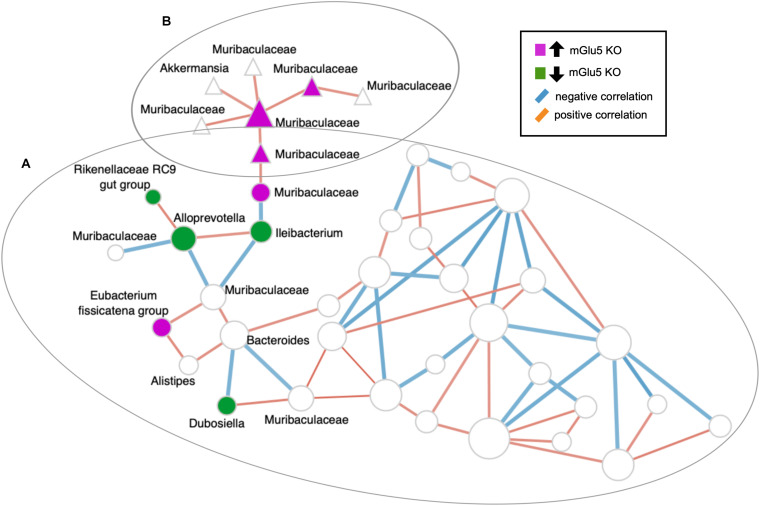
FIGURE 5.
SparCC-derived co-abundance network analysis. Nodes belonging to the same clusters calculated using the walktrap algorithm are depicted by their shapes (all nodes with circles belong to cluster (A), all nodes with triangles belong to cluster (B)). Nodes that were detected by sPLS-DA and their first neighbors were labeled. Nodes colored in magenta are amplicon sequence variants (ASVs) detected by sPLS-DA to be increased in KO mice, while the nodes colored in dark green are ASVs detected by sPLS-DA to be decreased in KO mice. ASVs are shown at the Genus level, in the case where Genus is not assigned, the next highest taxonomy level is shown. The edges (lines connecting two circles) are colored according to their correlation: blue for negative correlation, red for positive correlation. Isolated nodes are omitted from the network.

