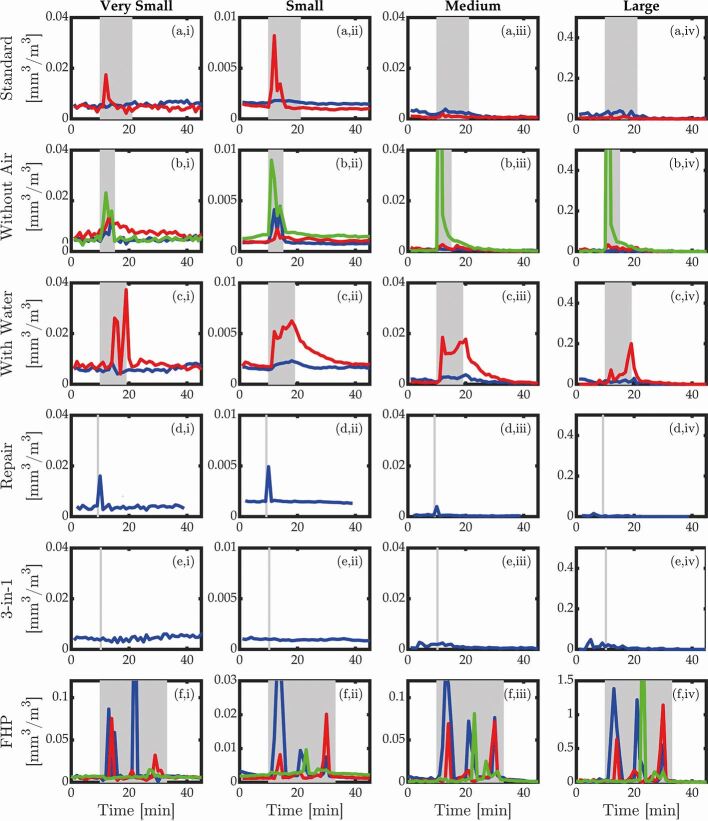
Fig. 3.
Variation in the measured concentrations of aerosols during each experiment. The rows correspond to the different procedures: a) standard debond; b) debond without air coolant; c) debond with water; d) repair of two teeth using standard debond approach (with air only); e) repair of two teeth; and f) debond using the fast handpiece. The columns show the concentrations for various size ranges of aerosols: i) very small; ii) small; iii) medium; and iv) large. The grey shaded regions indicate the time during which the procedure took place and the colours indicate the different repeated measurements, as shown in Table 2. Note that the y-axis scale is different for the fast handpiece procedures (row f)

