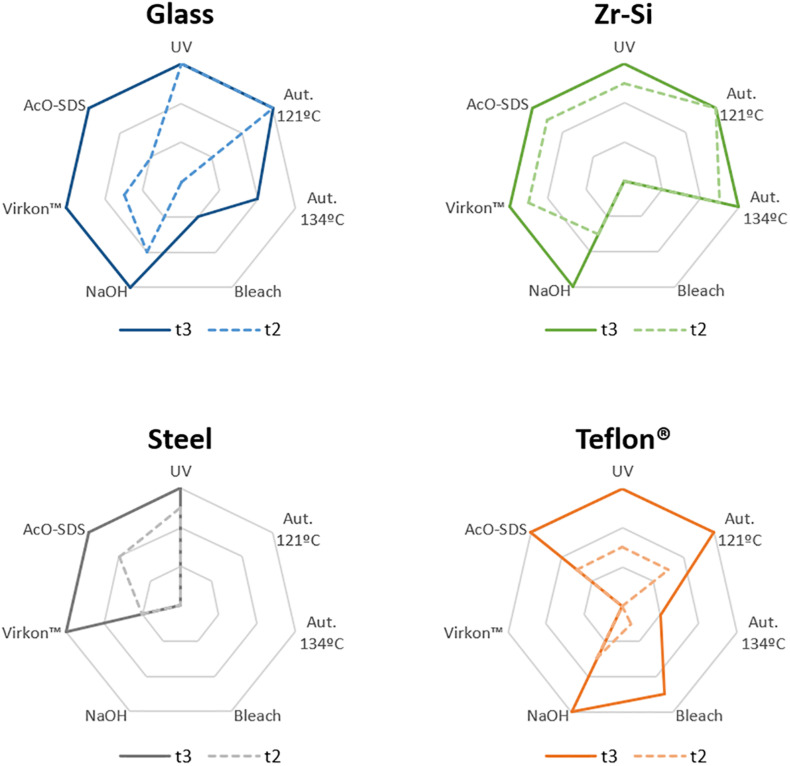
FIGURE 3.
Graphical representation of the results obtained for rec-PrPres propagation in PMSA from the different prion-coated beads treated with the chosen different decontamination procedures. Radar charts represent the number of replicate tubes subjected to PMSA showing rec-PrPres by electrophoresis and total protein staining. Colored lines represent the presence of rec-PrPres, which indicates incomplete inactivation of the rec-PrPres adsorbed to the surface of the beads. t2 (dotted lines) refers to the shortest PMSA reaction time in which rec-PrPres was detected in the absence of any decontamination treatment but propagation has not reach a plateau, and t3 (solid lines) refers to the shortest PMSA reaction time in which rec-PrPres signal reached plateau which is considered to be the maximum propagation limit. Each axes of the radar chart represent one of the decontamination treatment used that are detailed in Table 1 (autoclave at 121°C, at 134°C, NaOH, bleach, VirkonTM and AcO-SDS treatment). The plots of the results of Table 2, show clearly that prions adsorbed to steel beads are the ones more easily eliminated by most of the treatments used, and also that bleach and autoclave at 134°C are the most effective for decontamination of prions from most of the surface materials tested, with the exception of Teflon® beads highly susceptible to the treatment with VirkonTM.

