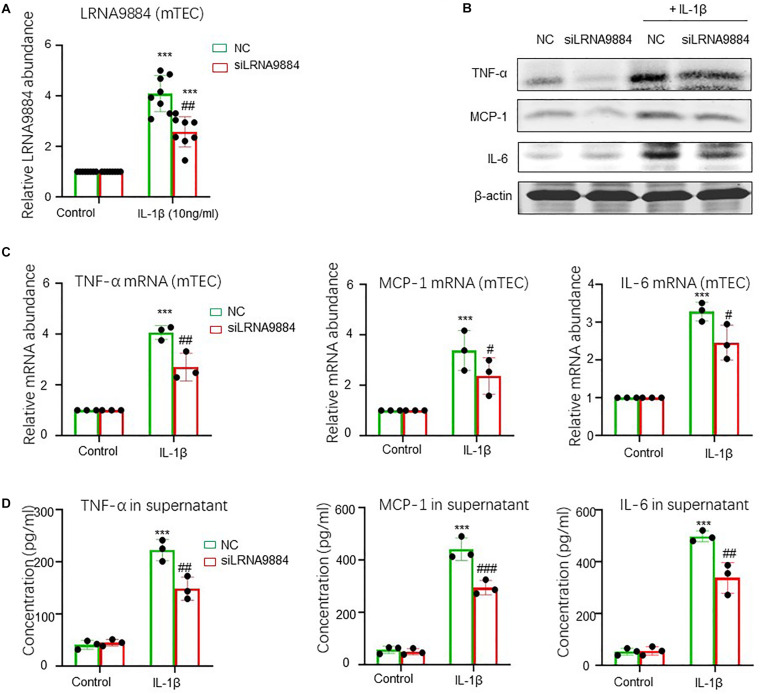
FIGURE 3.
Silencing of LRNA9884 blocks inflammatory cytokine expression. (A) Real-time PCR results shows LRNA9884 expression level for siLRNA9884 and nonsense-treated control (NC) after IL-1β-induced in mTECs. (B) Western blot shows expression of TNF-α, MCP-1 and IL-6 in IL-1β-induced mTECs. (C) Real-time PCR shows TNF-α, MCP-1 and IL-6 expression in NC and siLRNA9884 mTECs for control and IL-1β groups. Bars represent the mean ± SEM for at least three independent experiments. (D) ELISA shows TNF-α, MCP-1 and IL-6 expression in NC and siLRNA9884 mTECs for control and IL-1β groups. ***P < 0.001 vs. Control group, #P < 0.05, ##P < 0.01, ###P < 0.001 vs. NC group.

