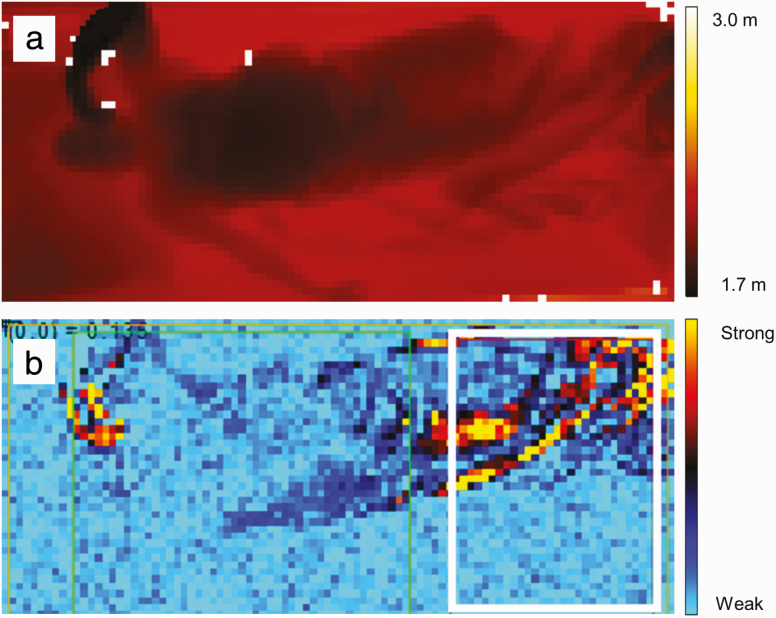
Figure 1.
(a) Depth image of the distance between the sleeping subject and the 3D sensor. (b) Motion image that shows the pixel-wise variation of the 3D video frames over time with movements visible in “hot” colors (red/orange/yellow). The white rectangular image section represents the area in which movements were analyzed to identify leg movements.

