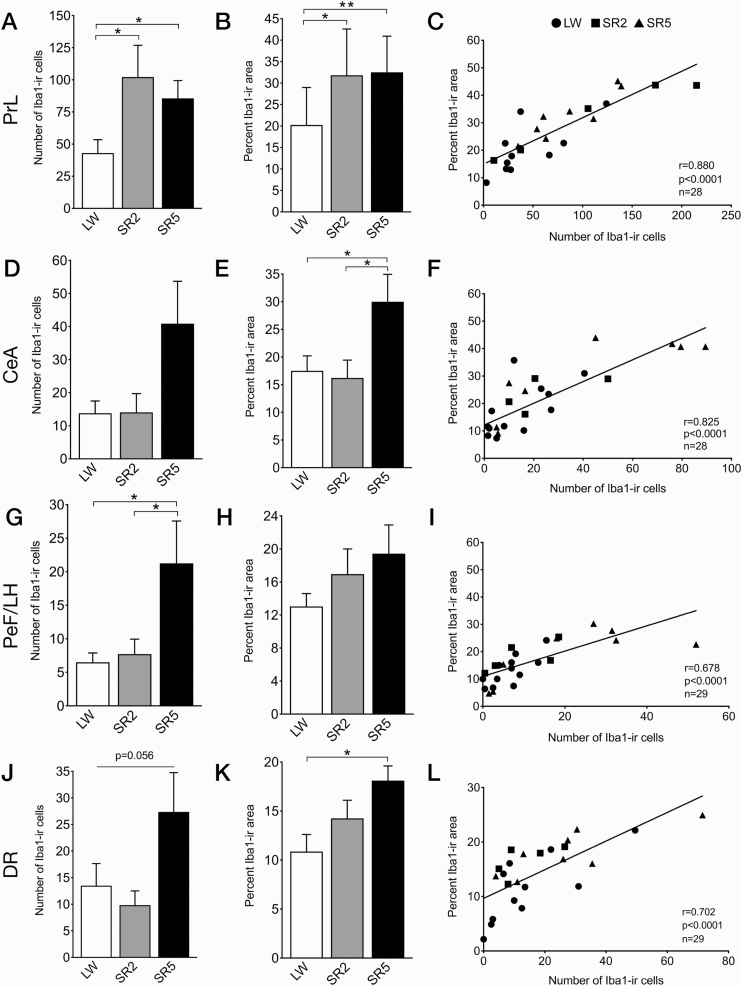
Figure 2.
The number of Iba1-ir cells (left), density of Iba1 immunoreactivity (middle), and scatterplots of the density versus cell counts (right), in the four brain regions that showed significant increases in Iba1 immunoreactivity during and/or following CSR, including the prelimbic cortex (PrL; A–C), central amygdala (CeA; D–F), perifornical lateral hypothalamic area (PeF/LH; G–I), and dorsal raphe nucleus (DR; J–L). Data are shown as means ± SEM for the LW (n = 4), SR2 (n = 8 or 9), and SR5 (n = 8) groups. The LW2 and LW5 control groups were combined into a single LW group (n = 11 or 12). Cell counts are obtained from respective analysis boxes and are expressed per section per side of the brain. Regression lines are shown as solid lines. *p < 0.05, **p < 0.01 (Fischer’s LSD post hoc tests).

