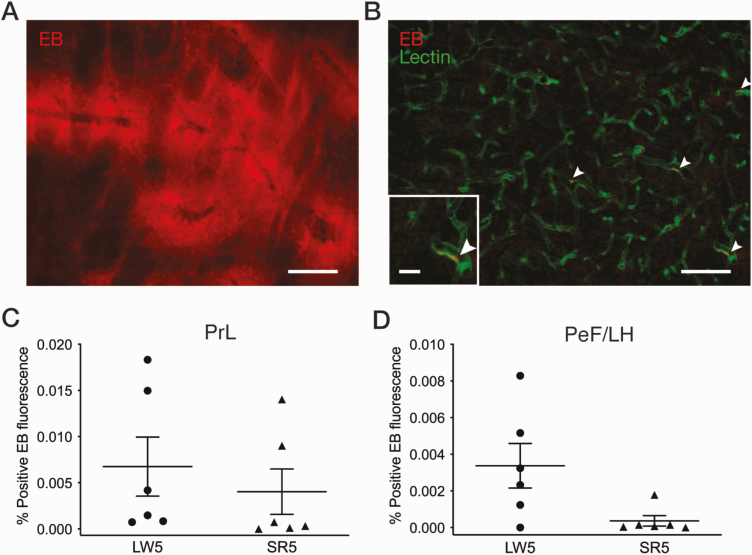
Figure 4.
Quantification of Evans Blue (EB) dye fluorescence in brain tissue following CSR. (A) Example of a fluorescent microscope image showing EB extravasation (red) in the striatum of a positive control rat with cryoinjury. Scale bar = 150 µm. (B) Example of a fluorescent microscope image in the prelimbic cortex (PrL) of an SR5 rat showing blood vessels identified with tomato lectin-FITC (green) and EB (red). White arrowheads indicate EB remaining inside blood vessels; no EB fluorescence was observed outside of blood vessels. Scale bars = 100 µm and 25 µm (inset). EB fluorescence was quantified in the PrL (C) and perifornical lateral hypothalamic area (PeF/LH; D) for the SR5 (n = 6) and LW5 (n = 6) groups. Each symbol represents a rat. See Experiment 3 in Methods for calculation of percent positive EB fluorescence area. CSR did not have a significant effect on the percent positive EB fluorescence area in either the PrL or PeF/LH (unpaired t-tests).

