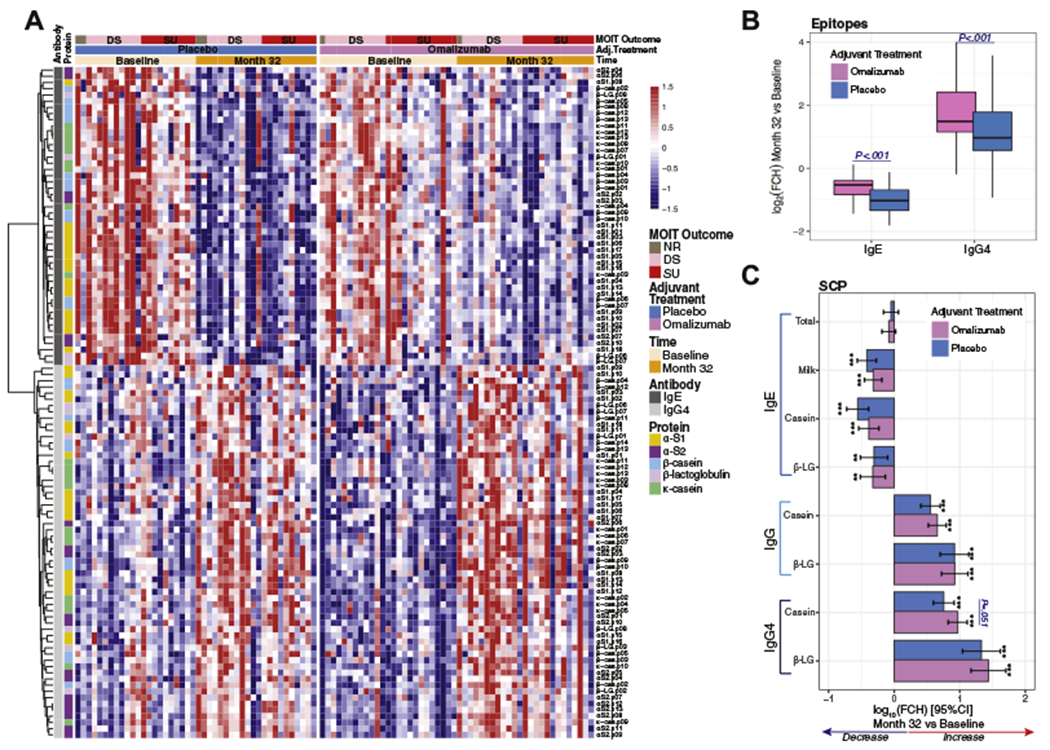
FIG 1.

Changes induced by MOIT in epitope-specific IgE or IgG4 binding by adjuvant treatment arm. A, Heat map representing (standardized) binding of 108 epitopes (48 IgE and 60 IgG4), with significant changes (fold change [FCH] > 1.5 and FDR ≤ 0.05) at month 32 from baseline. B, Box plot of the MOIT-induced log2 FCHs in epitope binding by adjuvant treatment. C, Bar plots of MOIT-induced changes and 95% CIs in log10 levels of SCPs. Asterisks represent a significant change at month 32 from baseline: *P < .05, **P < .01, and ***P < .001. DS, Desensitization; β-LG, β-lactoglobulin.
