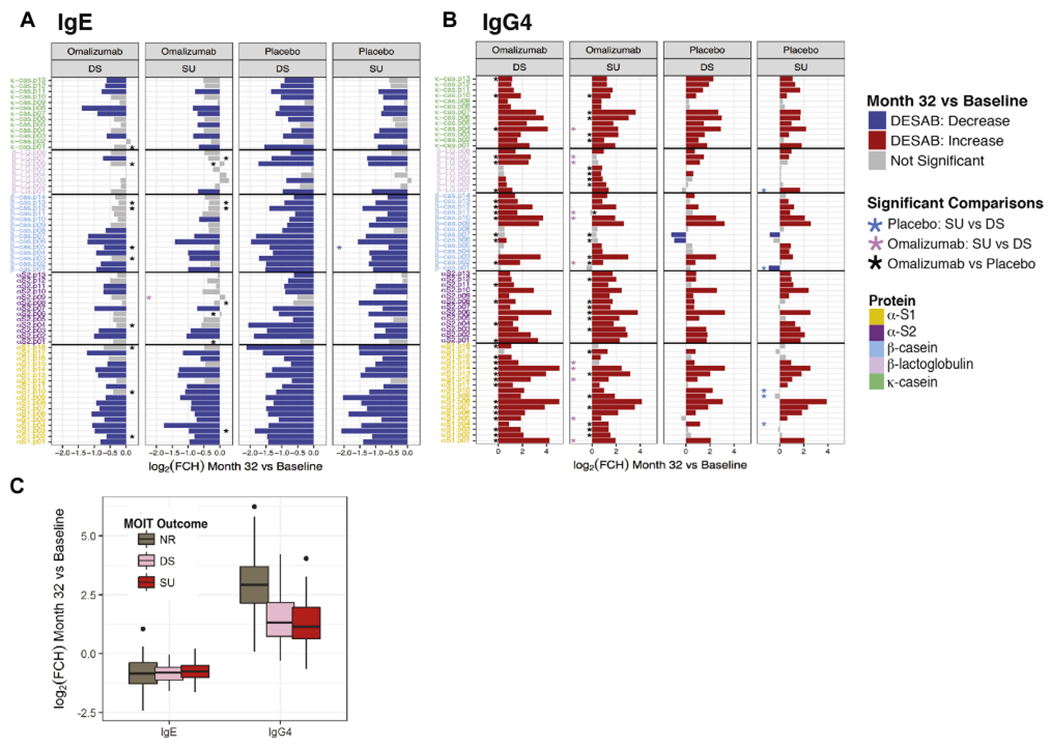
FIG 2.

Changes in ESAB by adjuvant treatment and MOIT outcome. A and B, Bar plots representing changes induced by MOIT in patients achieving only desensitization (DS) or SU by adjuvant treatment arm for each IgE and IgG4 epitope. The height of the bars represents the log2 fold change (FCH) in binding from baseline to month 32. Colors represent the direction of change (red, increase; blue, decrease) for the differential epitope-specific antibody binding (DESAB; FCH > 1.5 and FDR < 0.05). Colored asterisks indicate significance in changes between SU and DS outcomes for each adjuvant treatment (light blue, placebo; light pink, omalizumab); black asterisks represent DESAB, with significant differences between omalizumab and placebo for each outcome. C, Box plot of MOIT-induced changes in ESAB by MOIT outcome. NR, Nonresponder.
