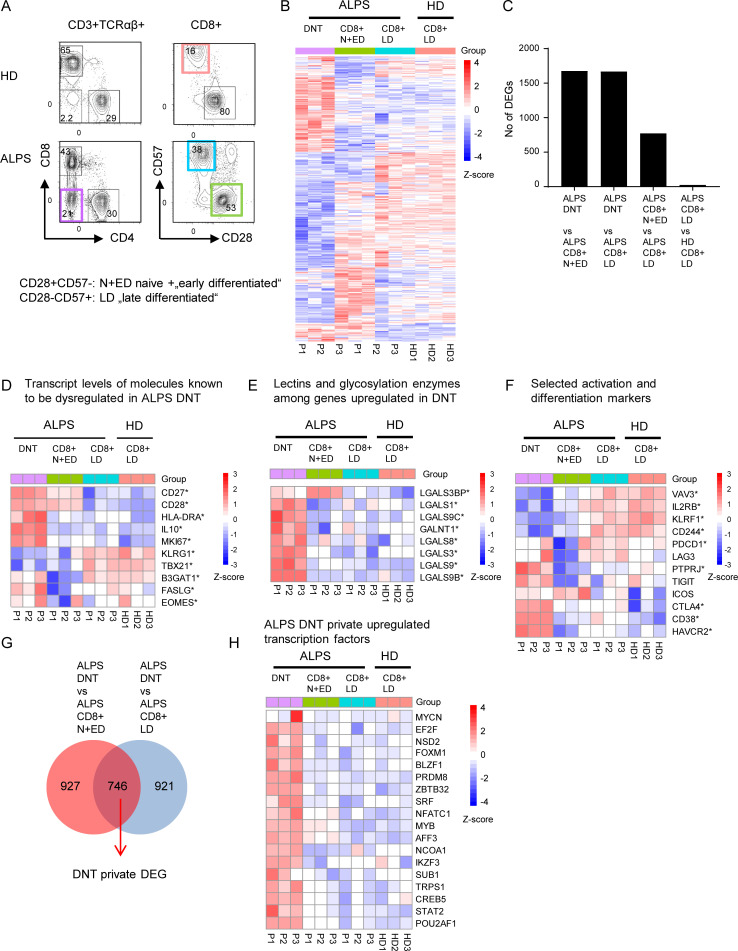
Figure 1.
DNTs in ALPS-FAS patients show a unique transcriptional profile. (A) Gating strategy for DNTs, CD8+CD28+CD57− N+EDs, and CD8+CD28-CD57+ LDs of three ALPS-FAS patients (P1–P3) and CD8+ LDs of three adult HDs (HD1–HD3) sorted for RNA sequencing analysis. (B) Heatmap showing all DEGs significantly dysregulated (adjusted P < 0.05) in any comparison of ALPS DNTs versus ALPS CD8+ N+EDs, ALPS DNTs versus ALPS CD8+ LDs, ALPS CD8+ N+EDs versus ALPS CD8+ LDs, or ALPS CD8+ LDs versus HD CD8+ LDs. (C) Number of DEGs (adjusted P < 0.05) for each comparison. (D) Heatmap showing transcripts of molecules known to be dysregulated in ALPS DNTs. (E) Heatmap of selected genes coding for lectins or enzymes involved in glycosylation. (F) Heatmap of selected genes involved in T cell activation or differentiation. * in D–F indicates that a gene was significantly (adjusted P < 0.05) dysregulated in at least one comparison. (G) Venn diagram showing the intersection of shared DEGs in the comparisons of ALPS DNTs versus ALPS CD8+ N+EDs and ALPS DNTs versus ALPS CD8+ LDs (ALPS DNT “private” genes). (H) Heatmap of up-regulated transcription factors among ALPS DNT private DEGs. For all heatmaps, the relative expression (Z-score) of genes is shown and is color coded according to the legend. Rows are scaled to have a mean value of 0 and an SD of 1.

