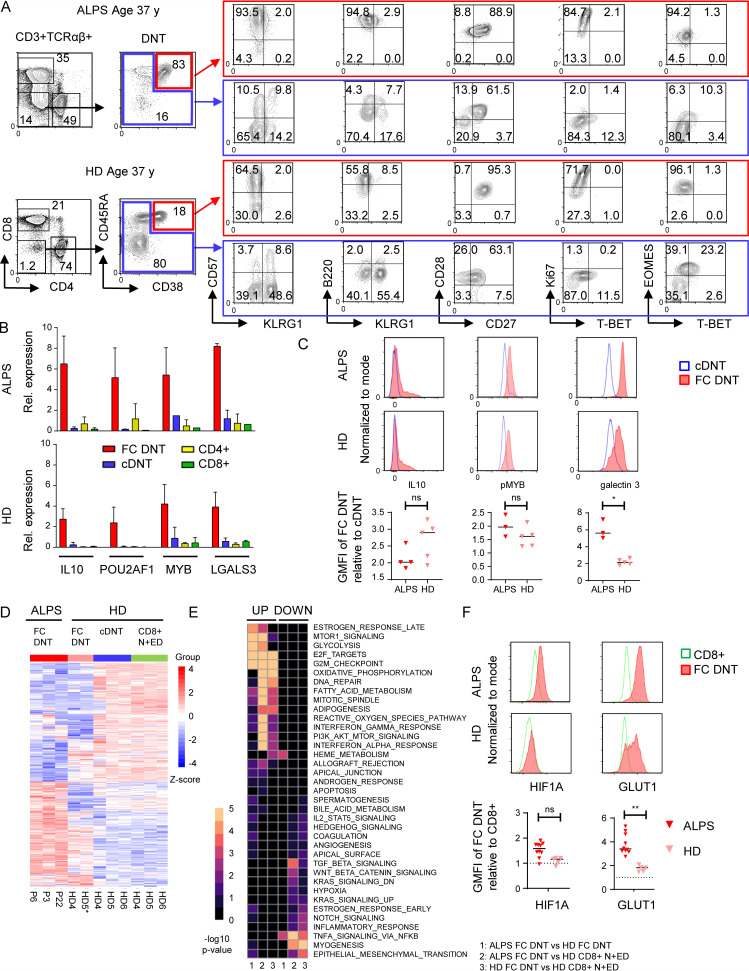
Figure 3.
FC DNTs are present in HDs. (A) Example flow cytometric data showing selected surface marker and transcription factor expression in FC DNTs and cDNTs in one ALPS-FAS patient compared with one age-matched HD. Numbers in gates indicate percentages. Another 5 ALPS-FAS patients and 10 HDs (ages 0–73 yr) were analyzed with the same panel, yielding similar results (data not shown). (B) Relative (Rel.) expression of four genes selected from the top up-regulated ALPS DNT private DEGs identified by RNA sequencing analysis was quantified in sorted FC DNTs and cDNTs (based on CD38 and CD45RA expression) as well as total CD4+ and CD8+ T cells from three ALPS-FAS patients and four HDs by quantitative RT-PCR. Expression was normalized to HPRT, and mean and SD values are shown. (C) Representative histograms showing IL-10, pMYB, and galectin 3 expression in FC DNTs and cDNTs of one ALPS patient and one HD. Summary plots showing geometric mean fluorescence intensity (GMFI) of IL-10, pMYB, and galectin 3 in FC DNTs relative to cDNTs in three or four ALPS patients and 5 HD. Lines indicate median values. Statistical comparisons were performed using the Mann-Whitney U test. (D) Heatmap showing all DEGs significantly dysregulated (adjusted P < 0.05) in any comparison between ALPS FC DNT, HD FC DNT, HD cDNT, and HD N+ED CD8+ T cells. Cells were sorted from P3, P6, and P22 and from HD4, HD5, and HD6. For the FC DNT HD5 sample, RNA was pooled from four HDs to achieve sufficient RNA (HD5*). Relative expression (Z-score) of genes is shown and is color coded according to the legend. Rows are scaled to have a mean value of 0 and an SD of 1. (E) Gene set enrichment analysis heatmap showing the top 10 up- and down-regulated hallmark pathways in ALPS FC DNTs versus HD FC DNTs (1), ALPS FC DNTs versus HD + N+EDs (2), or HD FC DNTs versus HD CD8+ N+EDs (3). Color code represents the −log10 P value. (F) Representative histograms showing hypoxia-inducible factor-1α (HIF1A) and GLUT1 expression in FC DNTs compared with CD8+ T cells of one ALPS patient and one HD. Summary plots showing GMFI of FC DNTs relative to CD8+ T cells in 10 ALPS patients and 5 HDs. Lines indicate median values. Statistical comparisons were performed using the Mann-Whitney U test. *, P < 0.05; **, P < 0.01. ns, not significant.

